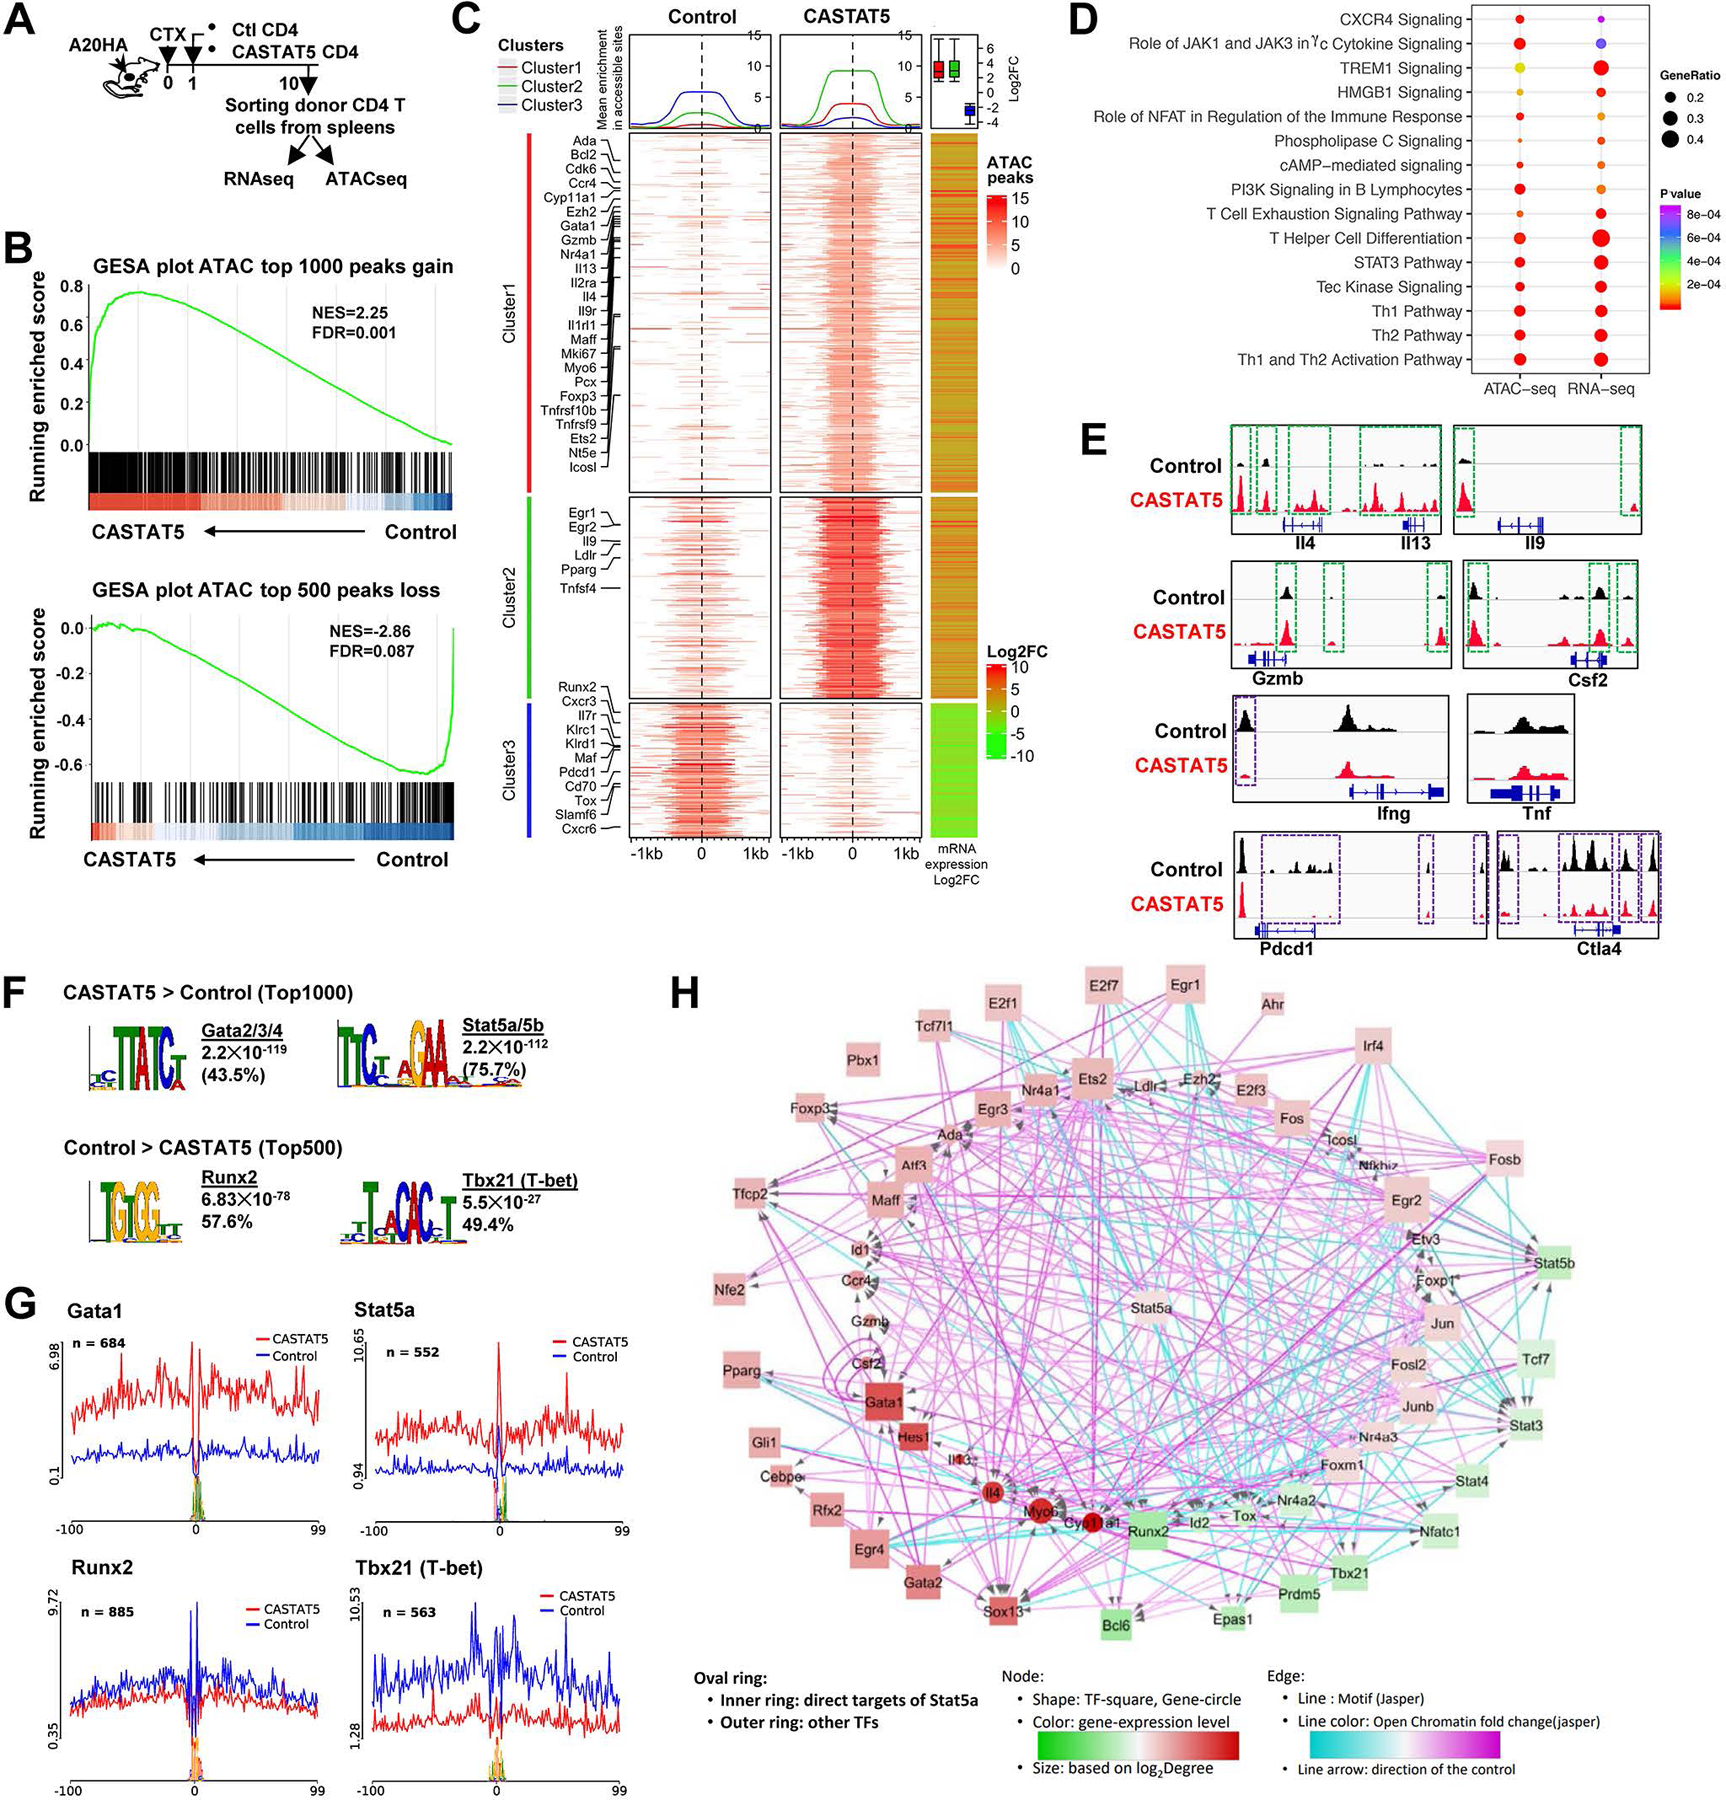
Fig. 3. Chromatin accessibility and transcriptome profiling identifies key regulatory molecules.

(A) The schema depicts the experimental procedures. (B) GSEA results demonstrating the correlation between chromatin states and transcription activities. Genes associated with top 1000 ATAC peaks gained and top 500 peaks lost in CASTA5 CD4+ T cells were used as separate gene sets and compared with rank sorted gene expression from matched samples. (C) The left two heatmaps illustrate differential chromatin accessibility at 2kb windows centered at the summit of the ATAC peaks (absolute log2FC ≥2and adjusted p-value <0.05). The ATACseq data from 3 biological replicates were merged and used to plot the heatmap. Genes are grouped into 3 clusters with clusters 1 and 2 showing variable degree gain of peaks while cluster 3 showing loss of peaks, indicative of increased and reduced chromatin accessibility, respectively, in CASTAT5 CD4+ T cells compared to control CD4+ T cells. The line graphs on top of the heatmap demonstrate the average accessibility profiles of each cluster. The RNAseq data (absolute log2FC ≥1.5and adjusted p-value <0.05) are used to generate the column on the right which shows matched average expression log2FC of 3 replicates, and the results are summarized in the box plot shown on top of the column. Representative genes with significant changes in both chromatin accessibility and gene expression are listed beside the heatmap. (D) IPA results from both ATACseq and matched RNAseq datasets. The genes associated with differential ATACseq peaks (absolute log2FC ≥ 1, adjusted p-value <0.05) and differentially expressed genes (absolute log2FC ≥1, adjusted p-value <0.05) are used in the IPA analysis. (E) The chromatin accessibility tracks of genes related to polyfunctionality. Tracks in red and blue correspond to CASTAT5 and control CD4+ T cells, respectively. The green rectangles mark ATAC peaks showing increased signal intensity in CASTAT5 CD4+ T cells compared to control CD4+ T cells, while the purple rectangles mark ATAC peaks that disappeared or reduced in intensity in CASTAT5 CD4+ T cells. Each ATACseq track showing was randomly selected from one of three biological replicates. (F) The results from MEME-Chip motif analysis identified transcription factor consensus binding sites significantly enriched in the top 1000 and top 500 ATAC peaks with gain or loss of chromatin accessibility in CASTAT5 CD4+ T cells, respectively. (G) Results from the transcription factor footprinting analysis using the ATACseq data. The line plot indicates the normalized chromatin accessibility signals centered at the 200bp window flanking the indicated transcription factor binding sites. (H) A transcription regulatory network built on the ATACseq and RNAseq data from this study, as well as a published Stat5a ChIP-seq data (GSE79518).
