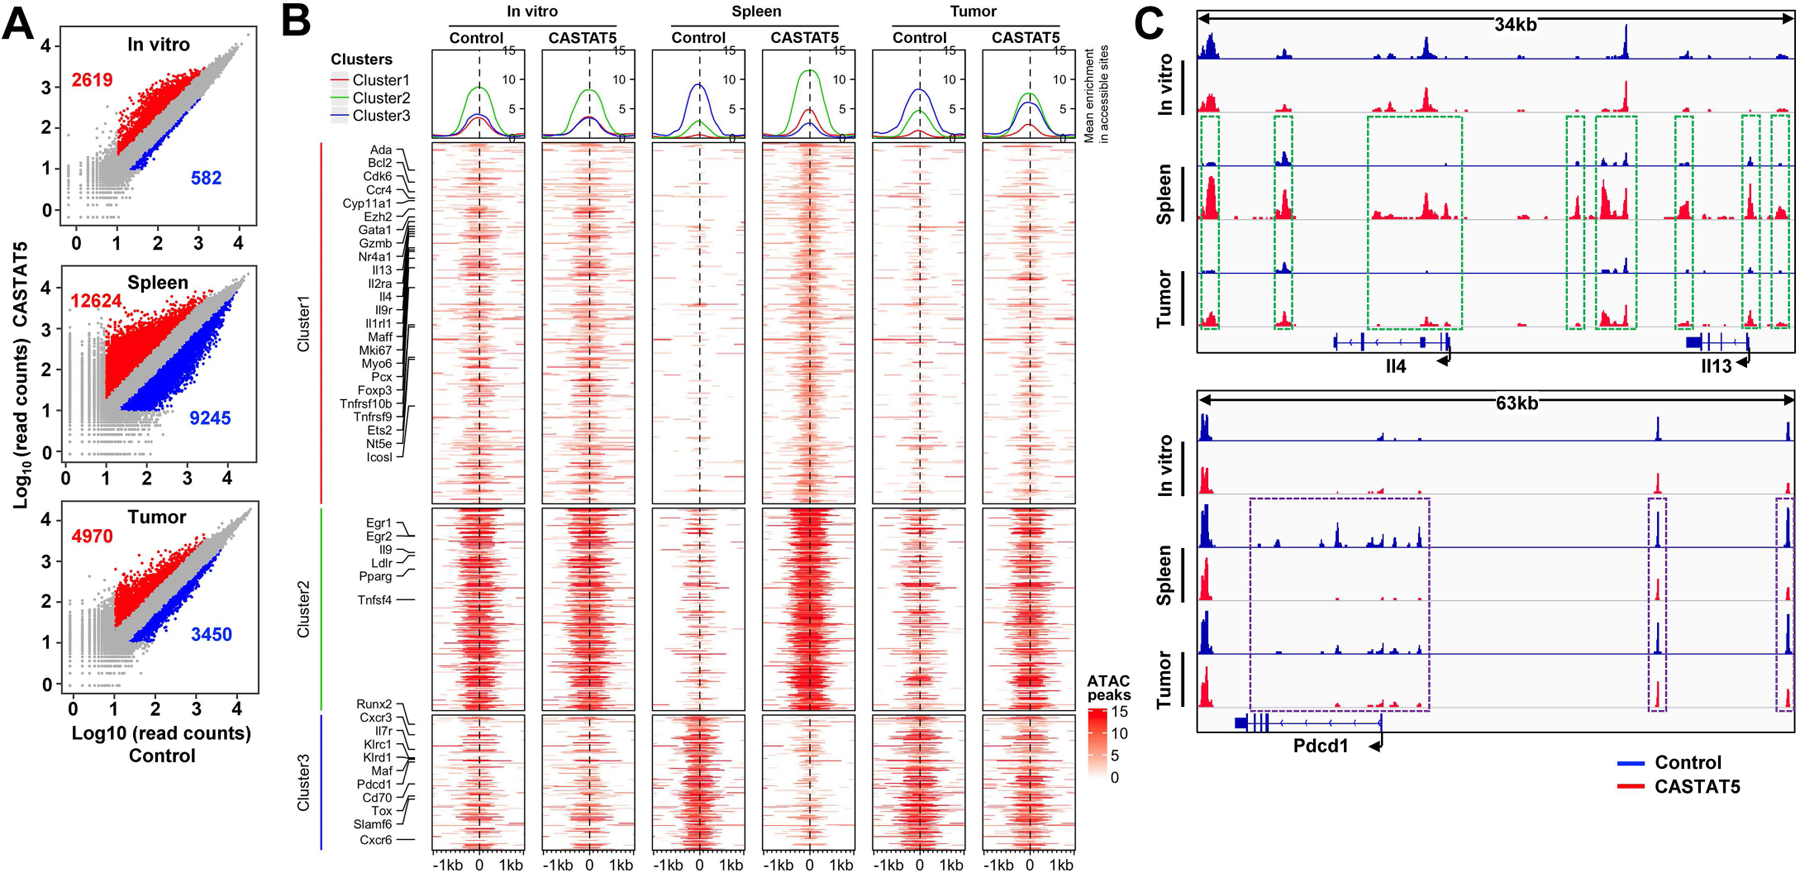
Fig. 4. The differential chromatin accessibility profiles observed in spleen-derived CASTAT5 and control CD4+ T cells are detected in tumor-derived samples.

Following the experimental procedures depicted in Fig. 3A, spleen and tumor samples were collected separately 10 days after T cell transfer. For each group, donor CD4+ T cells were flow cytometry-sorted separately from 3 different mice. Equal numbers of sorted cells from the 3 biological replicates were pooled together and processed for ATACseq. Control and CASTAT5 CD4+ T cells collected in vitro before adoptive transfer were also processed for ATACseq. (A) Scatter plots comparing the ATACseq peak signals between paired CASTAT5 and control samples isolated in vitro and from spleen and tumor samples. The numbers in each panel indicate the number of peaks with gain (red) or loss (blue) of chromatin accessibility, respectively. (B) Heatmaps that illustrate differential chromatin accessibility at 2kb windows centered at the summit of the ATACseq peaks identified between different samples. The heatmaps were generated using the same ATACseq peak regions from Fig. 3C and plotted in the same orders. Line graphs on top of the heatmaps demonstrate the average accessibility profiles of clusters 1–3, respectively. (C) Chromatin accessibility tracks of representative genes. Tracks in red and blue correspond to CASTAT5 and control CD4+ T cells, respectively. The green rectangles on spleen and tumor-derived samples mark ATACseq peaks showing increased signal intensity in CASTAT5 CD4+ T cells compared to control CD4+ T cells. The purple rectangles on spleen and tumor-derived samples mark ATACseq peaks that disappeared or reduced in intensity in CASTAT5 CD4+ T cells. These differential ATACseq peak profiles between CASTAT5 and control CD4+ T cells are not observed in in vitro samples.
