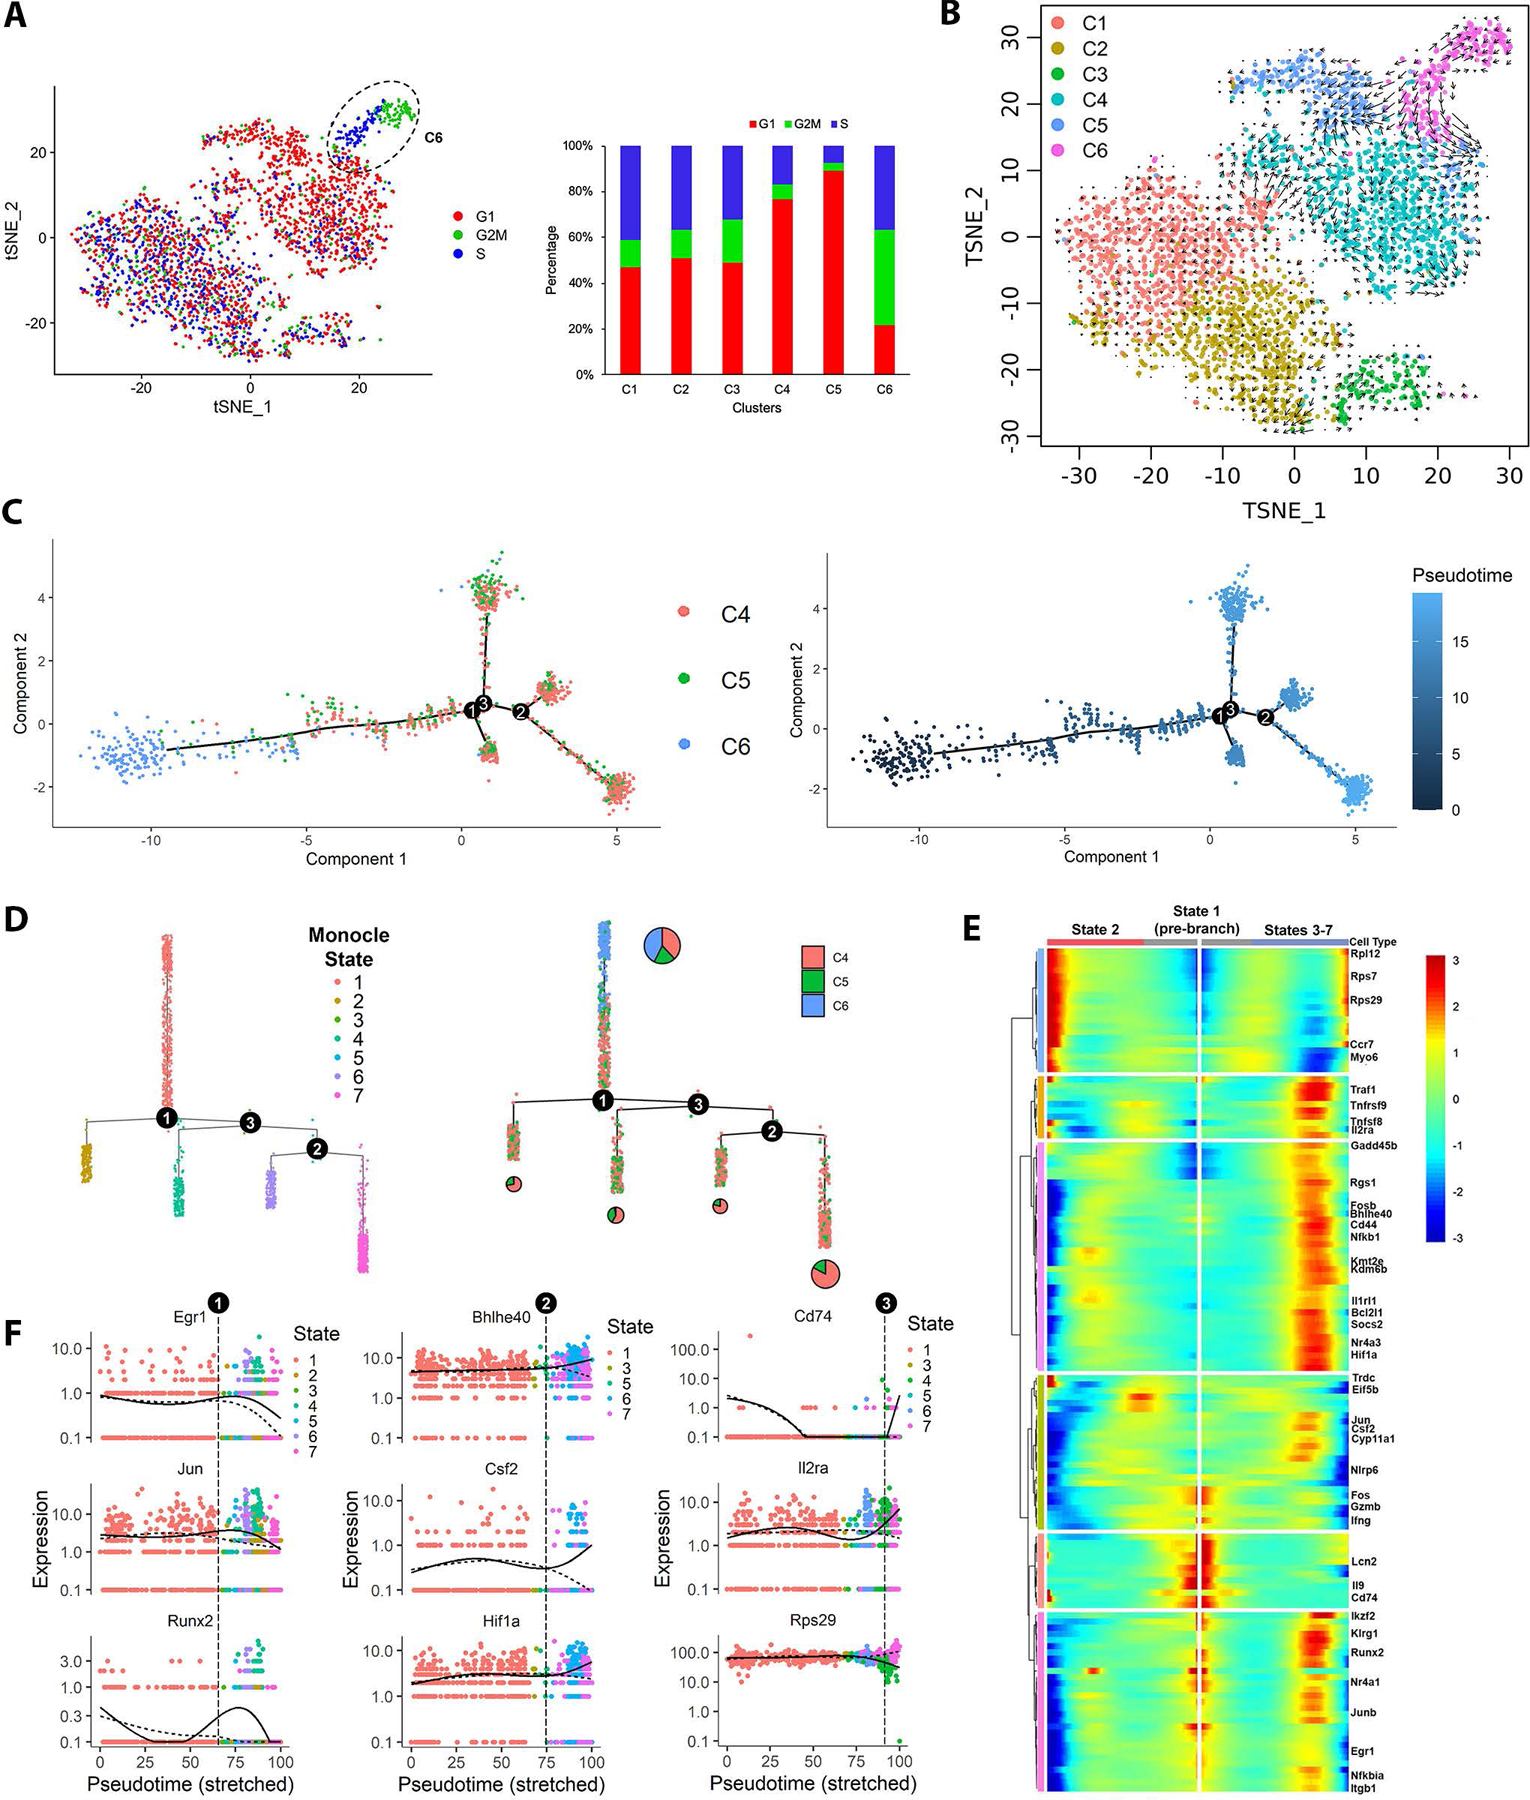
Fig. 6. Cell cycle, RNA velocity and pseudotime trajectory analyses reveal dynamic transition of cell cycle and transcription programming in CASTAT5, but not in control CD4+ T cells.

(A) The t-SNE plots of CASTAT5 and control CD4+ T cells are constructed with cell cycle scores calculated using Seurat based on a group of 97 cell cycle genes. The color key indicates the cell cycle phase. The bar graph at right summarizes the percent of cells in G1, G2/M and S phase according the cell cycle scores in each cluster as defined in Fig. 5A. (B) The RNA velocity plot describes the dynamic mRNA transcription states in CASTAT5 and control CD4+ T cells. The RNA velocity field is projected on the tSNE space in Fig. 5A. The direction of cell state transition, and RNA velocity are indicated by the vectors (arrows) and their lengths, respectively. (C) The plot on the left shows the order of CASTAT5 CD4+ T cells from 3 different clusters along the pseudotime trajectory determined by Monocle. Each dot represents one cell. The colors indicate the clusters to which the cells belong, as defined in Fig. 5A. The plot on the right shows the trajectory of CASTAT5 CD4+ T cells plotted by pseudo differentiation time. The trajectory branchpoints are marked by numbered circles. (D) Monocle trajectory ordered as a cluster tree. Cells in the left panel are labeled by monocle cell states, while cells in the right panel are labeled by Seurat clusters as defined in Fig. 5A. The pie charts within the right panel describe the proportion of cells in the Seurat clusters distributed among branches of the cluster tree. (E) Heatmap of the branchpoint-dependent differentially expressed genes (adjusted p-value <0.001) identified by Monocle showing a trend of gradual changes of gene expression along the pseudotime trajectory at the first branchpoint. The columns show gene expression levels at each point in pseudotime, the rows indicate the corresponding genes. The starting point of pseudotime is placed in the center of the heatmap. The left-half of the heatmap, from center to left, shows the gene expression trend in pseudotime changing from cell state 1 towards cell state 2. The right-half of the heatmap, from center to right, shows the gene expression trend in pseudotime changing from cell state 1 towards cell states 3–7. (F) The expression levels of branchpoint-dependent genes ordered along the pseudotime trajectory. The gene shown in the left, middle and right panels are representative genes associated with cell fate determination at the first, second and third branchpoints, respectively.
