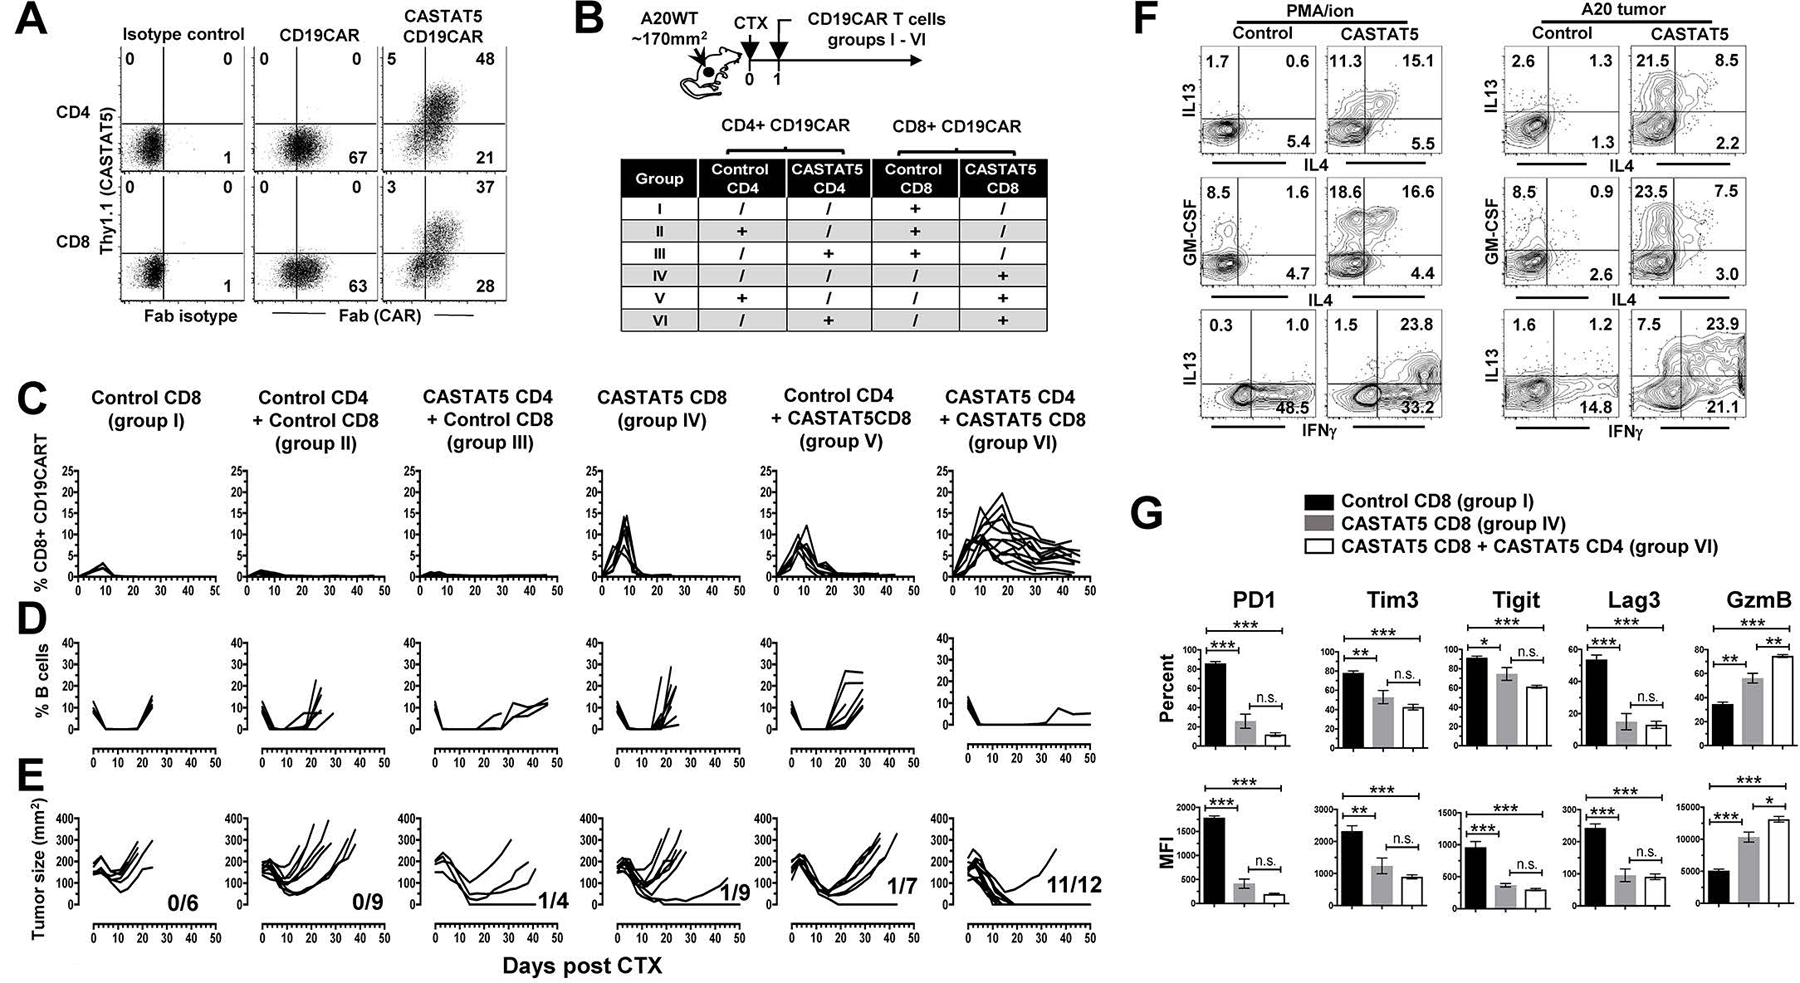
Fig. 8. Concurrent expression of CASTAT5 in CD4+ and CD8+ CD19CAR T cells leads to optimal therapeutic outcomes.

(A) Viral transduction efficiency in CD4+ and CD8+ T cells. CD4+ and CD8+ T cells were separately purified from CD45.1 mice. These cells were transduced to express CD19CAR alone or co-express CD19CAR and CASTAT5. Representative dot plots show the levels of CD19CAR and CASTAT5 in transduced T cells. CD19CAR was measured by anti-Fab stain and CASTAT5 was evaluated by Thy1.1 expression. The numbers in plots indicate the percentage of cells in the corresponding quadrant. (B) Experimental setup and treatment conditions. The schema depicts the experimental procedures. The different combinations of engineered CD4+ and CD8+ CD19CAR T cells used for adoptive transfer are outlined in the chart. (C) The frequencies of donor CD8+ T cells in recipient mice during the course of CD19CAR T cell therapy. At the indicated time points, tail blood was collected from mice and subjected to flow cytometry to detect the donor CD8+ T cells (CD45.1+CD8+). The frequencies of donor CD8+ T cells were plotted against time. The frequencies of host B cells (CD19+B220+) in blood were also evaluated by flow cytometry and summarized in (D). (E) Tumor growth curves of mice in each group. The numbers indicate the number of tumor-free mice among treated mice at the end point of experiment. (F and G) Phenotypic characterization of donor CD4+ and CD8+ CD19CAR T cells in selected groups. Ten days after T cell transfer, splenocytes isolated from a cohort of mice from the specified groups (3 mice/group) were subject to flow cytometry analysis. Splenocytes from groups V and VI were stimulated with PMA/ionomycin or A20 tumor cells for ICS to examine the cytokine profiles of control CD4+ and CASTAT5 CD4+ CD19CAR T cells (F). Numbers in representative dot plots indicate percentage of cells in the corresponding quadrant. Donor CD8+ T cells from groups I, IV and VI, which expressed CD19CAR alone, or co-expressed CASTAT5 and CD19CAR in the absence or presence of CASTAT5 CD4+ CD19CAR T cells, respectively, were examined for expression of the specified markers. The frequencies of cells positive for each of the markers and the mean fluorescence intensity (MFI) of these markers are summarized in bar graphs shown as mean ± s.d. of five samples per group. (G). n.s., not significant; *p < 0.05, **p < 0.01, ***p < 0.001.
