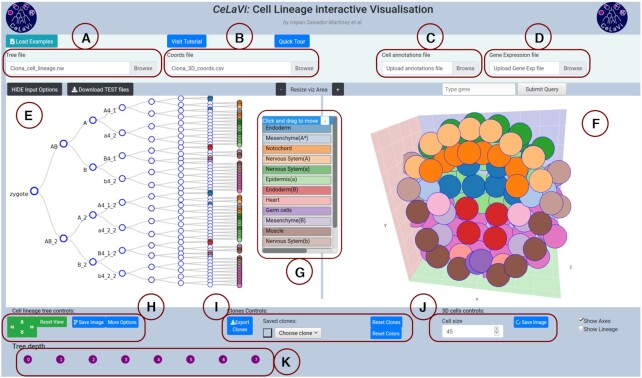
Figure 1.
The CeLaVi user interface, loaded with the Ciona intestinalis gastrula dataset. The main areas of the interface are labelled: (A) tree file input; (B) cell coordinates file input; (C) cell annotations file input; (D) gene expression file input; (E) lineage viewer; (F) 3D viewer; (G) cell annotations table; (H) cell lineage tree controls; (I) clones controls; (J) 3D cells controls; (K) tree depth area. Cells show cell fates with a colour code based on the cell annotations table. For more details visit the tutorial (http://www.celavi.pro/tutorial.html).

