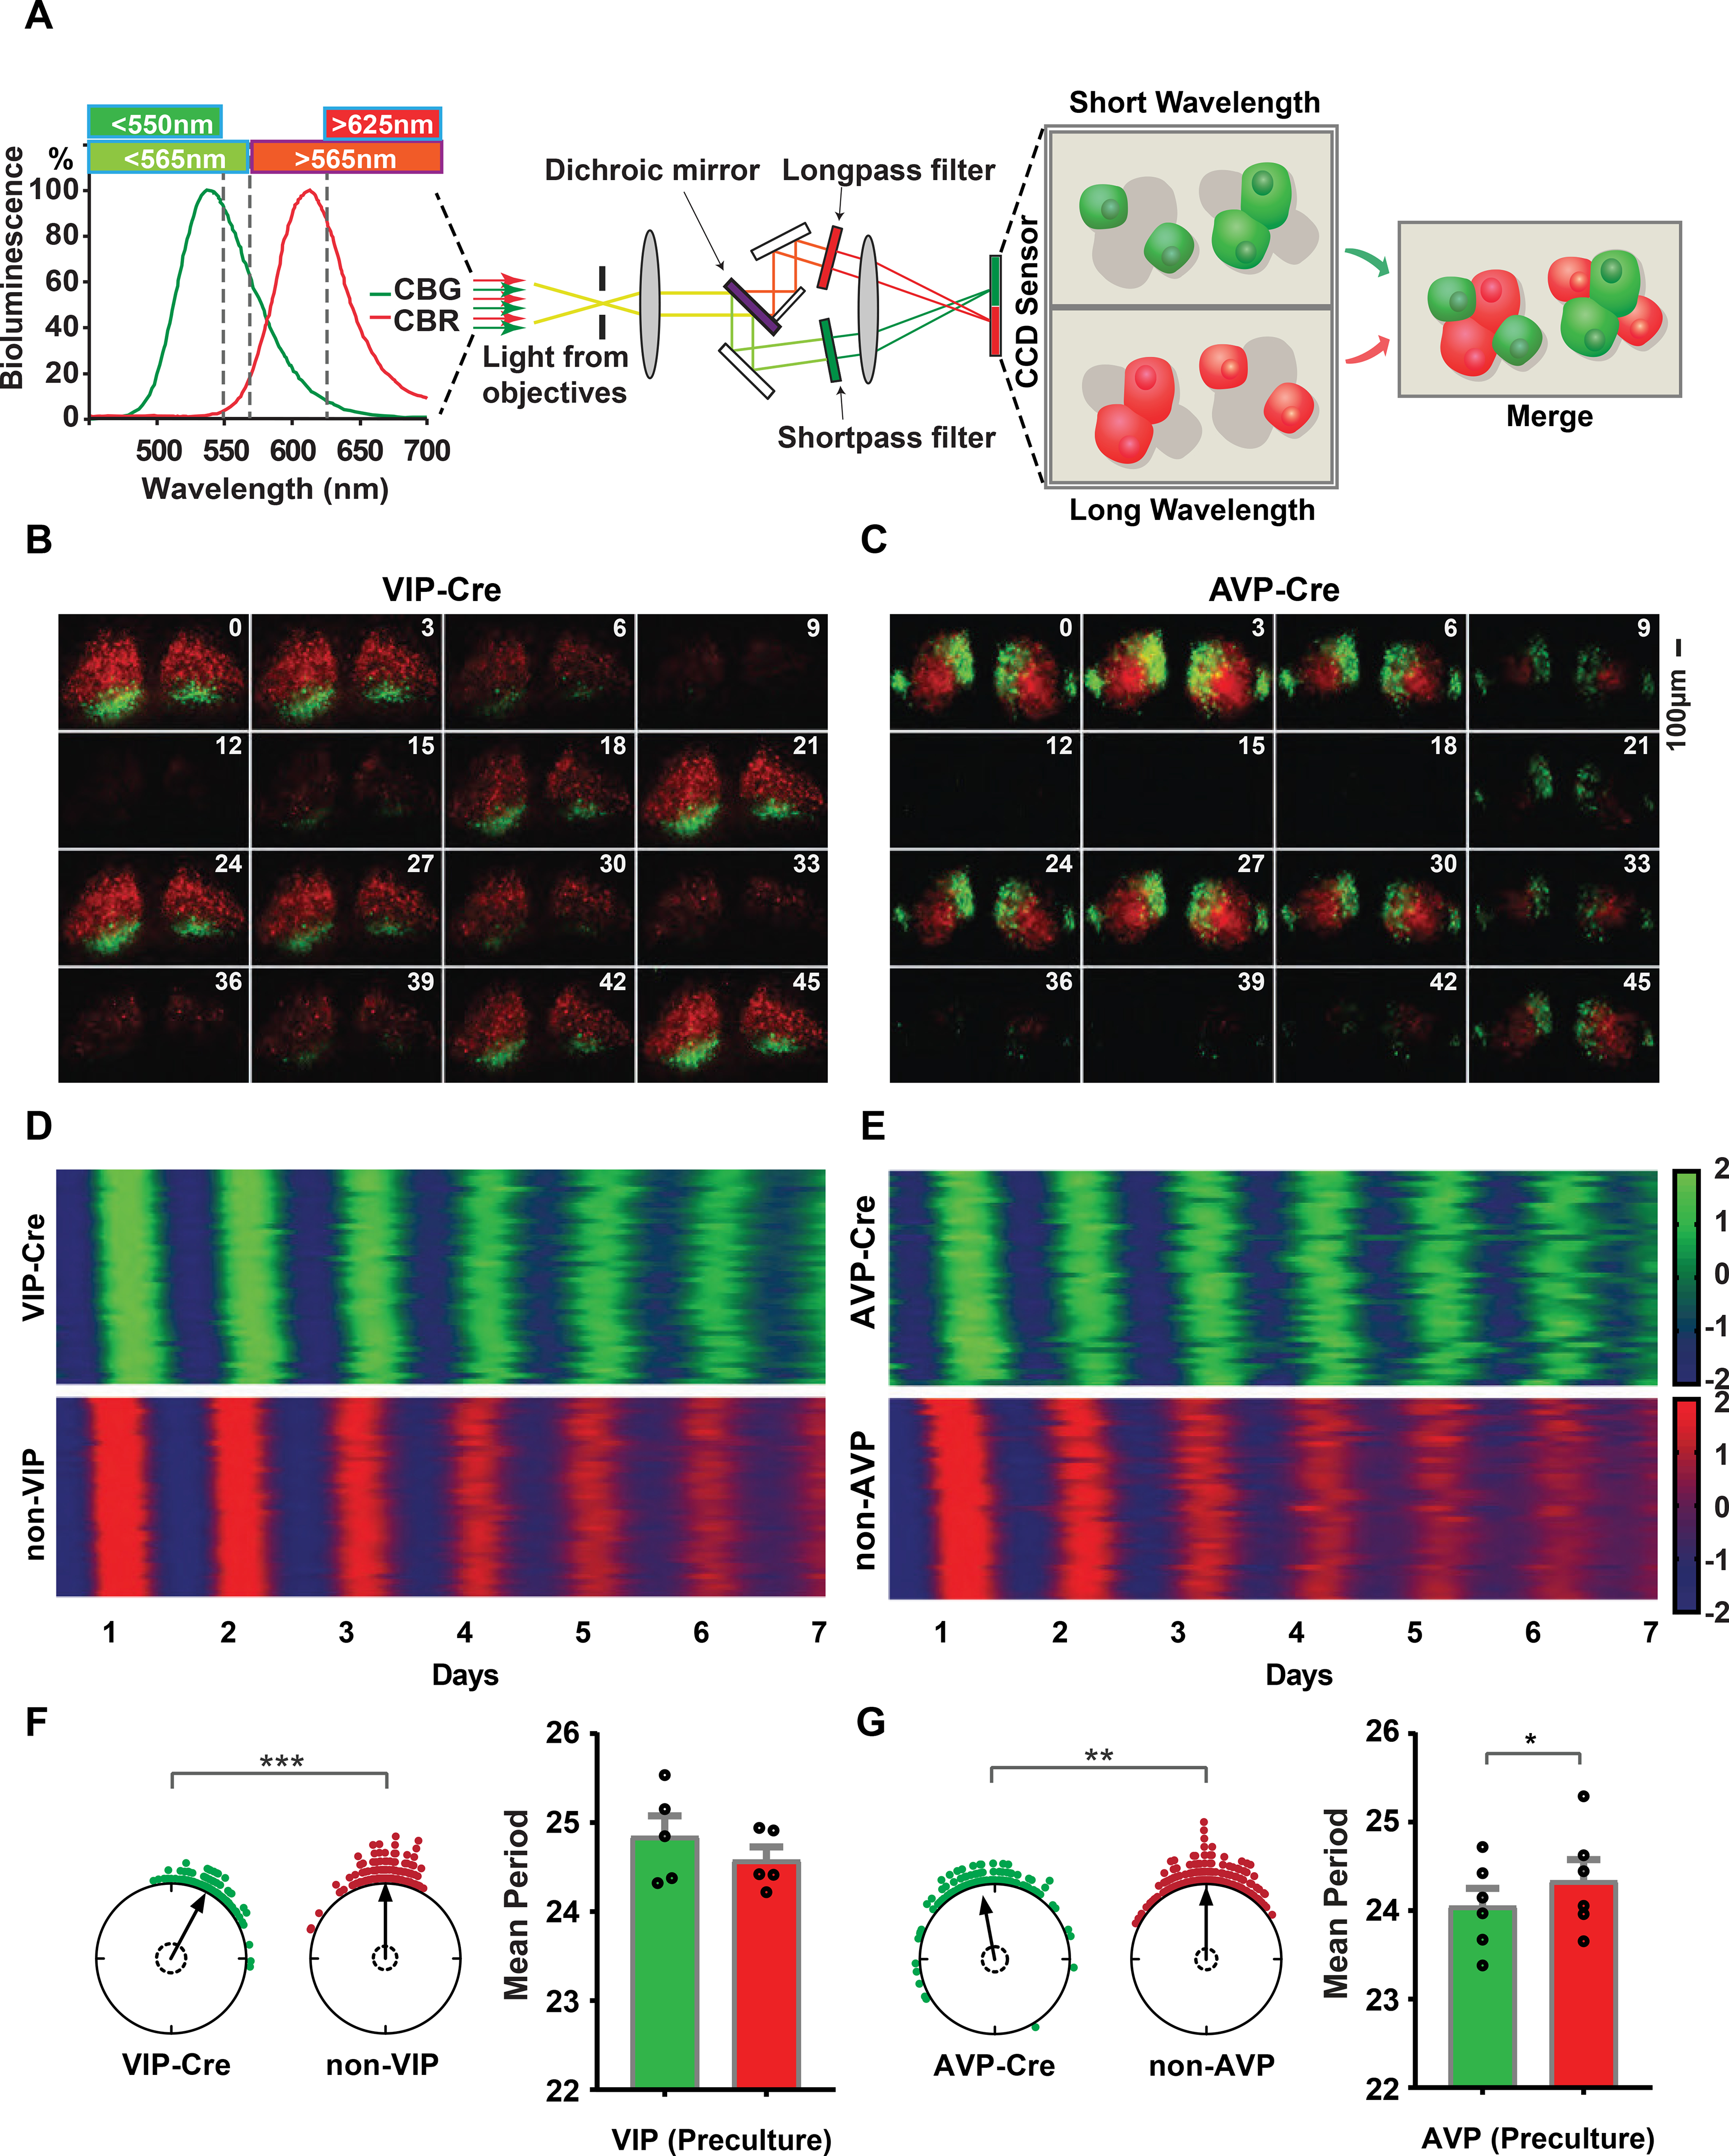
Figure 1: Dual-color bioluminescence imaging of VIP-Cre and AVP-Cre SCNs.

(A) Light-path of the dual-color imaging device. (B, C) Example time-lapse images for 48 hr from VIP-Cre and AVP-Cre SCN, respectively. Time interval between frames is three hours. SCN images were positioned with the ventral-dorsal axis vertically, optic chiasma at the bottom. Scalebar represents 100 μm. (D, E) Heat map representations of single-cell real-time imaging of two SCN slices for seven days. Each panel contains 40 single cells of each color in raster plots. The Z-score of detrended and denoised bioluminescence time series were color-coded between −2 to +2 as indicated by the color bar. Time series were ordered by phase with earlier phases placed at the top. (F, G) Rayleigh plots show the phases of single cells on day 6 and phases of green cells are shown relative to the normalized mean phase of red cells. Arrows are the R vector and dashed circles indicate the Rayleigh critical values. Individual data points are scattered as the circular plots. Asterisks indicate significant directional mean phase differences by Watson-Williams test (VIP, p value <0.001; AVP, p value=0.008). Mean +/− SEM period values from multiple slices and experiments (24.85±0.23 hrs, VIP; 24.58±0.15 hrs non-VIP; n=5 for VIP-Cre and 24.05±0.20hrs, AVP; 24.34±0.24, non-AVP; n=6 for AVP-Cre). Asterisks indicate the significance of t-test between green and red (* p ≤0.05; ** p ≤ 0.01; *** p ≤ 0.001). Detailed quantification results are included in Supplemental Data 1.
