
Figure 4: Comparison of the effects of loss of Bmal1 on Coupling in VIP and AVP neurons in the SCN.
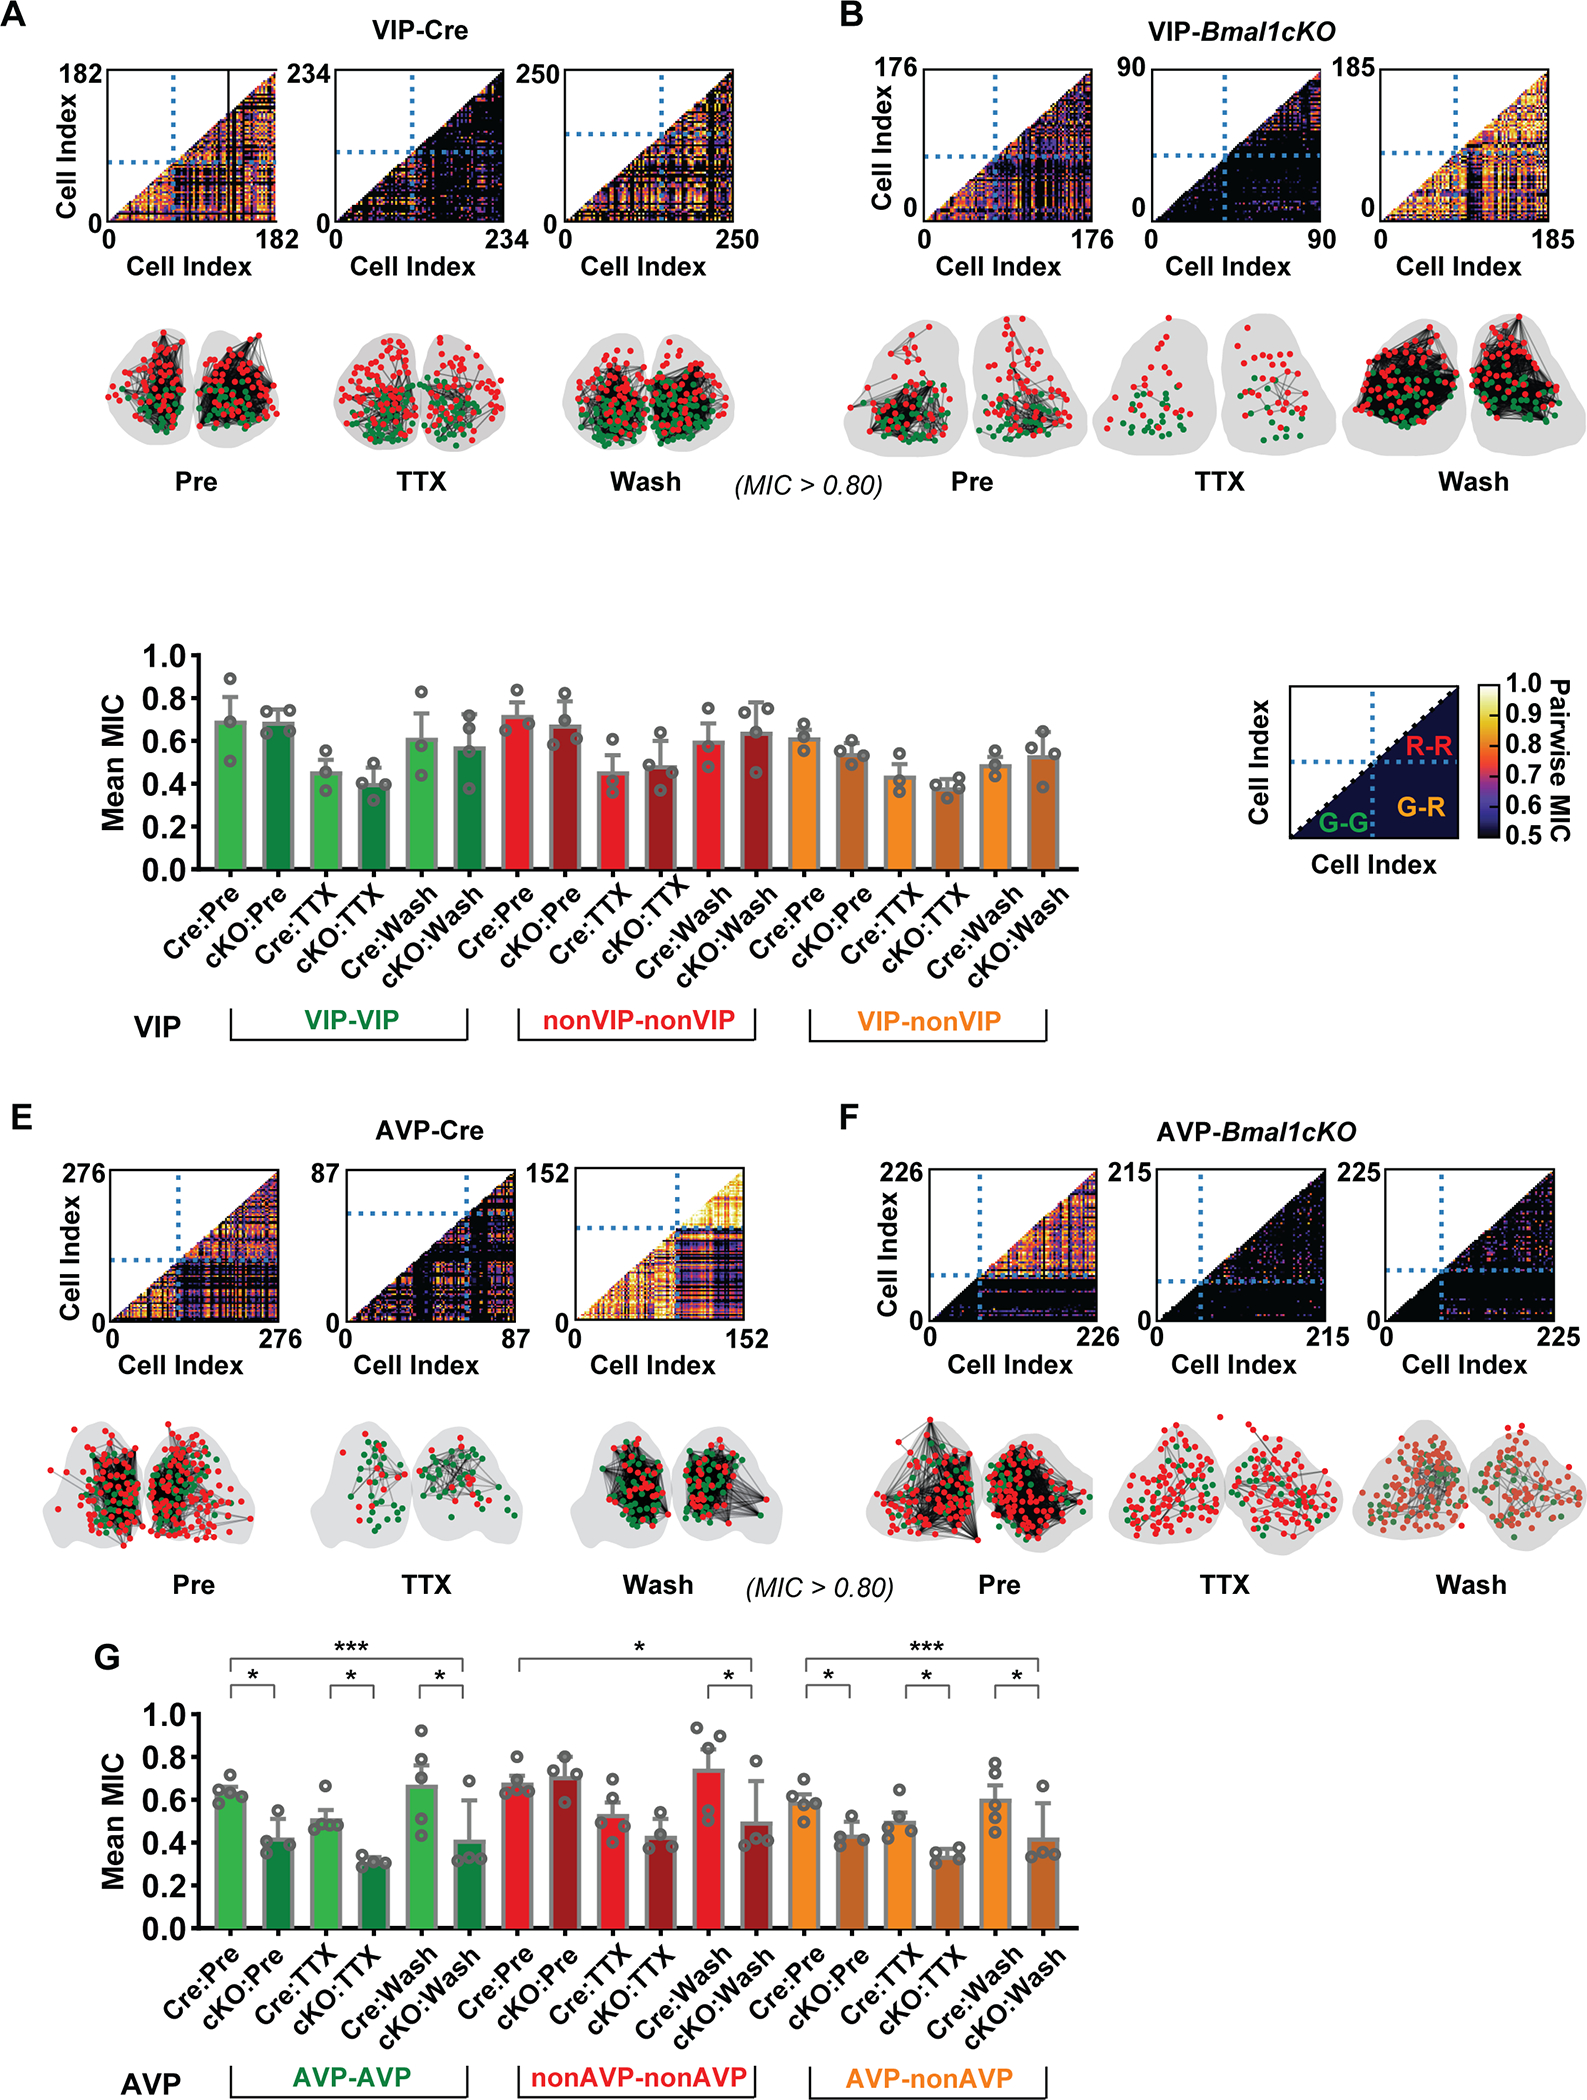
(A, B) Pairwise MIC score plots of neurons in the VIP SCN versus the VIP-Bmal1−/− (cKO) SCN, during pretreatment, TTX treatment, and washout. As annotated in D, horizontal and vertical dashed lines split the plot into four parts, including the lower-left part showing the pair-wise MIC value among green cells, lower-right part is MIC values of green-red pairs and higher-right part is red-red pairs. Correlation network was constructed from pairwise MIC analysis: A connection line was drawn when the MIC value of the cell pair is larger than 0.8. Right-left SCN associations are not shown. (C) Mean +/− SEM MIC scores are shown to compare three types of associations between VIP-Cre and VIP-Bmal1−/− SCNs. The associations were categorized as green-green (or KO-KO), red-red (or Cre-Cre) and green-red (or KO-Cre). Each mean MIC value from a replicate is represented by a point in the overlaid scatter plot (VIP, n=3; VIP-Bmal1−/−, n=4). Higher asterisks represent the significance of genotype factor in two-way ANOVA, and lower asterisks represent significance of Holm-Sidak’s multiple comparisons. (E, F) Pairwise MIC score plots of neurons in the AVP SCN versus the AVP-Bmal1−/− SCN, during pretreatment, TTX treatment, and washout. (G ) Mean +/− SEM of MIC scores are shown to compare three types of associations (as in C) between AVP-Cre and AVP-Bmal1−/− SCNs (AVP, n=5; AVP-Bmal1−/−, n=4). Asterisks indiciate significant differences (* p ≤0.05; ** p ≤ 0.01; *** p ≤ 0.001). Detailed quantification results are included in Supplemental Data 1.