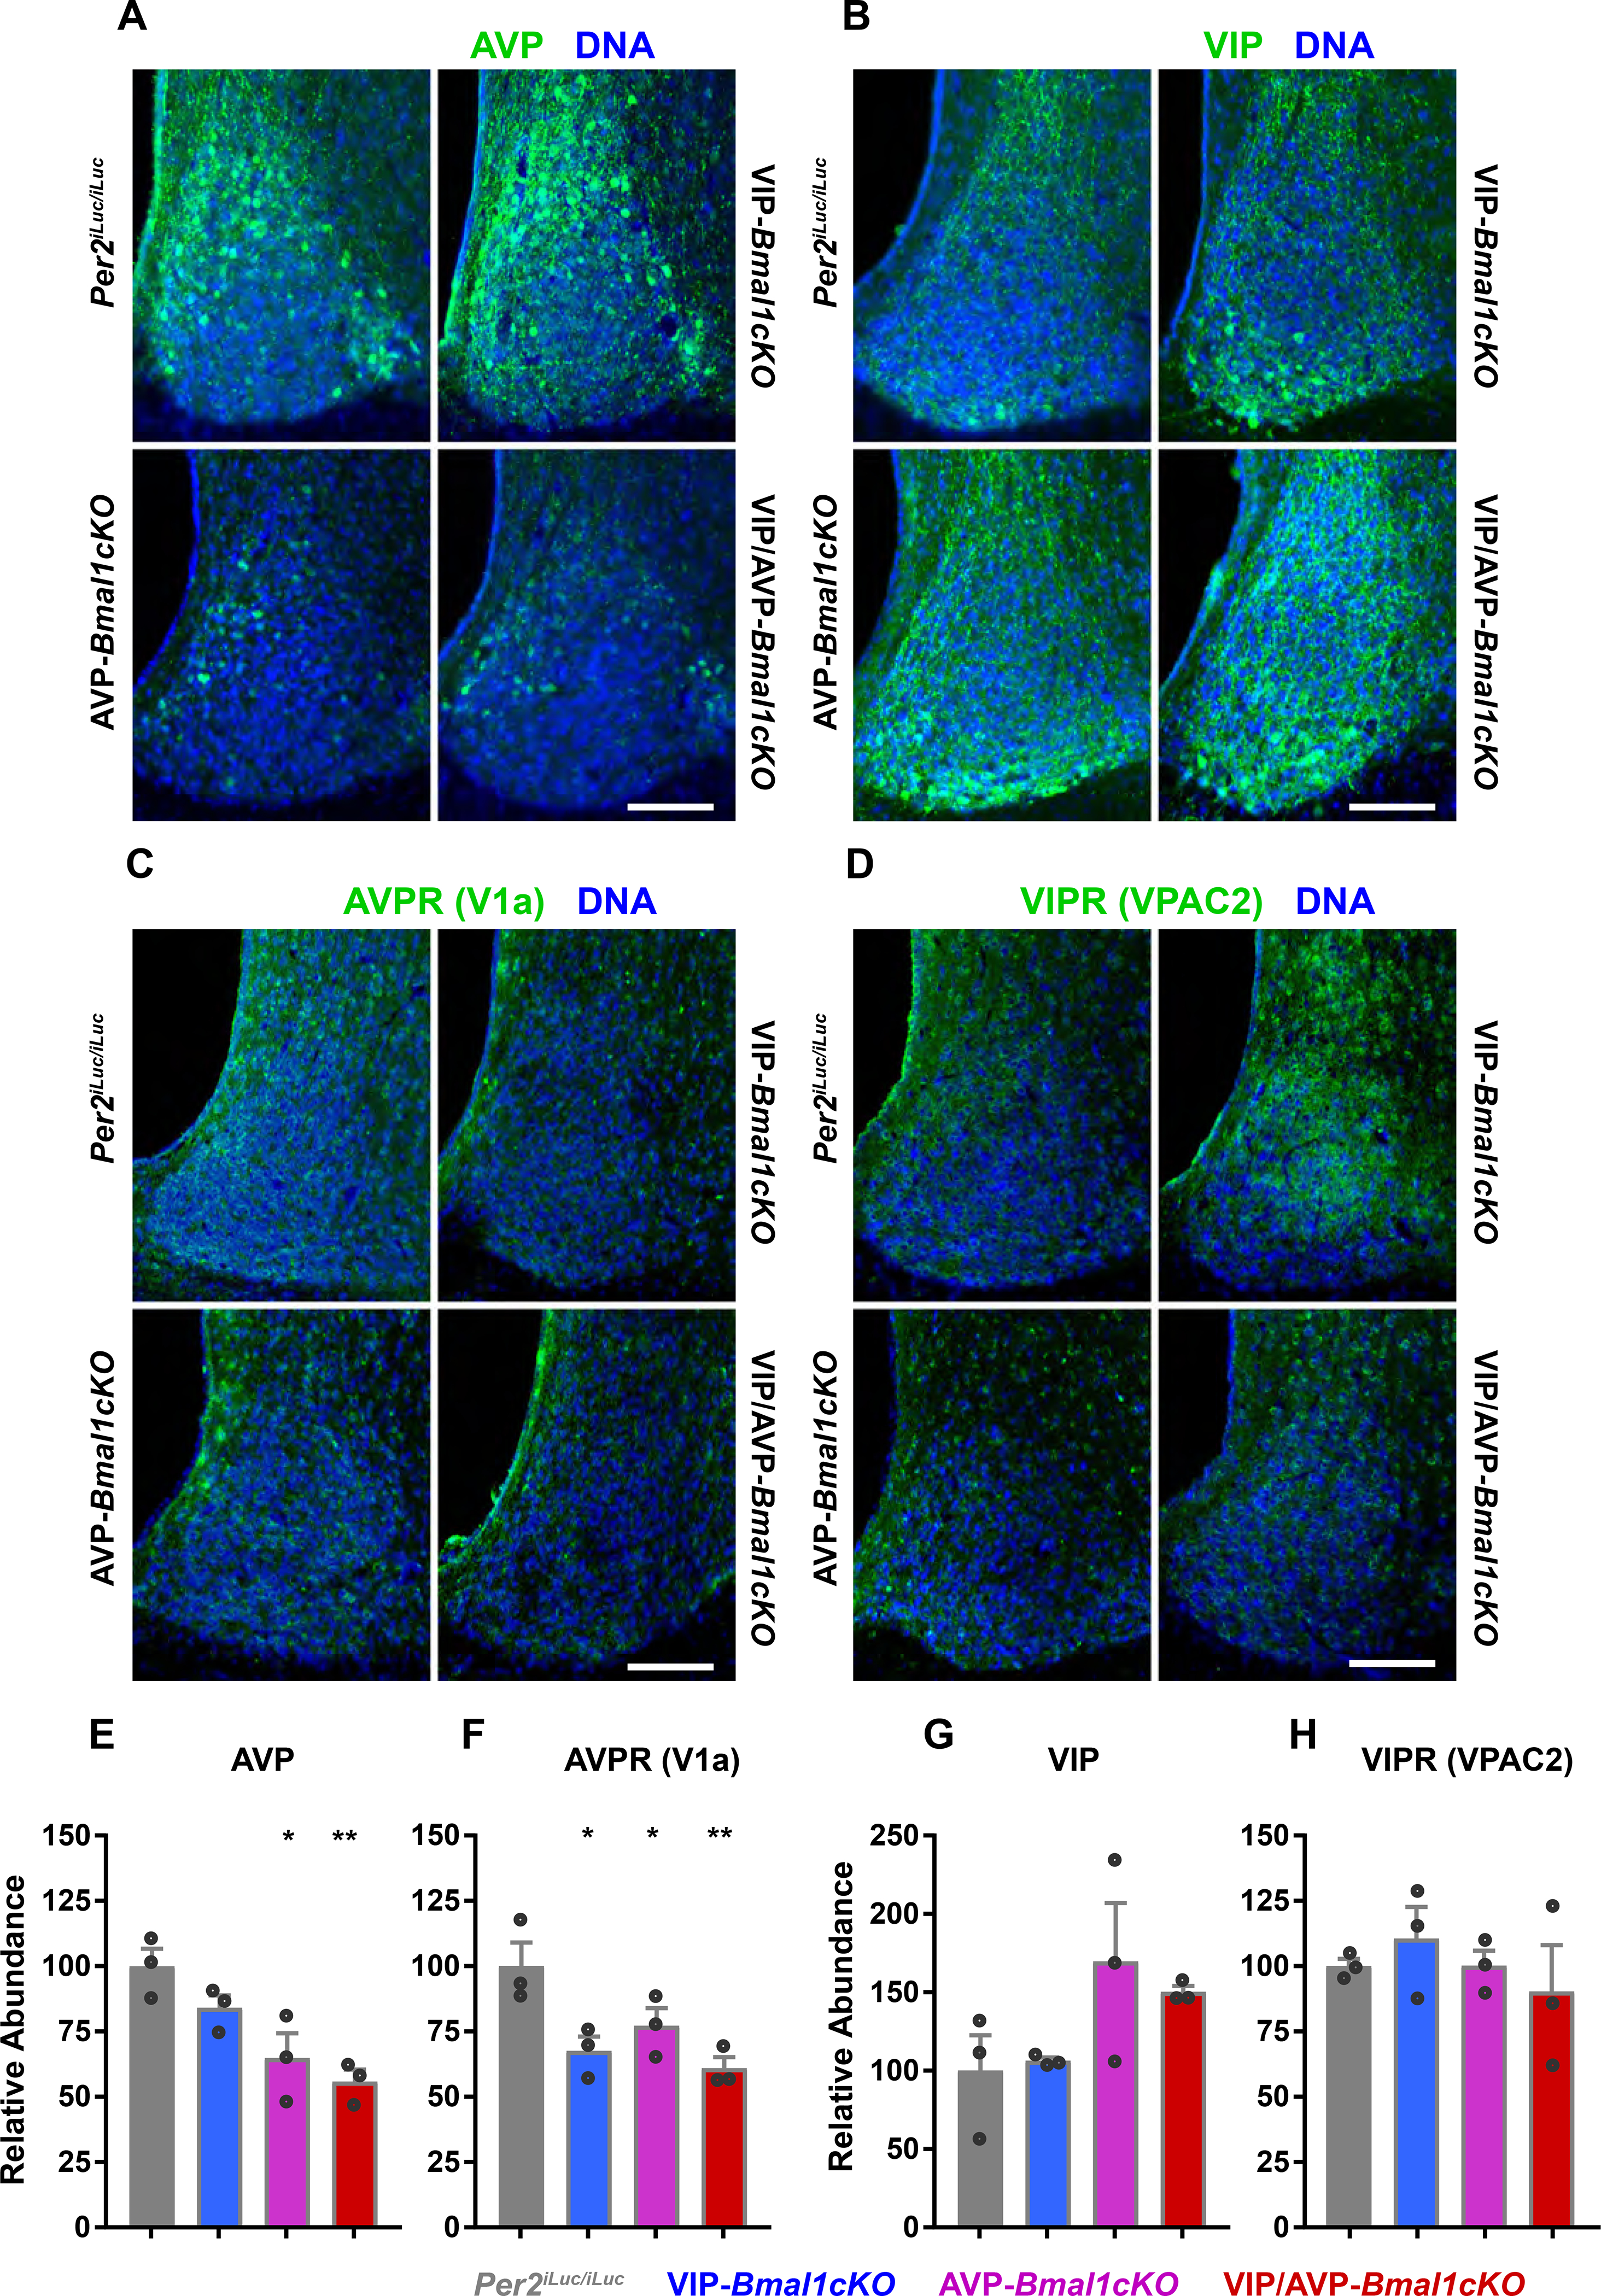
Figure 5: Immunofluorescent staining of key components of VIP and AVP signaling in VIP-Bmal1−/−, AVP-Bmal1−/− and VIP/AVP-Bmal1−/− SCNs.

(A - D) Immunofluorescent images from 50μm thick SCN slices from wildtype control, VIP-Bmal1−/− (cKO), AVP-Bmal1−/−(cKO) and VIP/AVP-Bmal1−/− (cKO) SCNs, stained with AVP, VIP, AVP receptor V1a and VIP receptor VPAC2 antibodies. Green signals from the neuropeptides or receptors are merged with the blue staining of nuclear DNA. Scale bars represent 100μm. (E-H) Mean +/− SEM plots of fluorescence intensity normalized to wildtype, VIP-Cre and AVP-Cre controls (one of each) are shown as the relative abundance. Each replicate is shown as a point in the overlaid scatter plots (all n=3). Asterisks indicate the significance of Holm-Sidak’s comparisons to controls and ANOVA adjusted p-value (* p ≤0.05; ** p ≤ 0.01; *** p ≤ 0.001).
