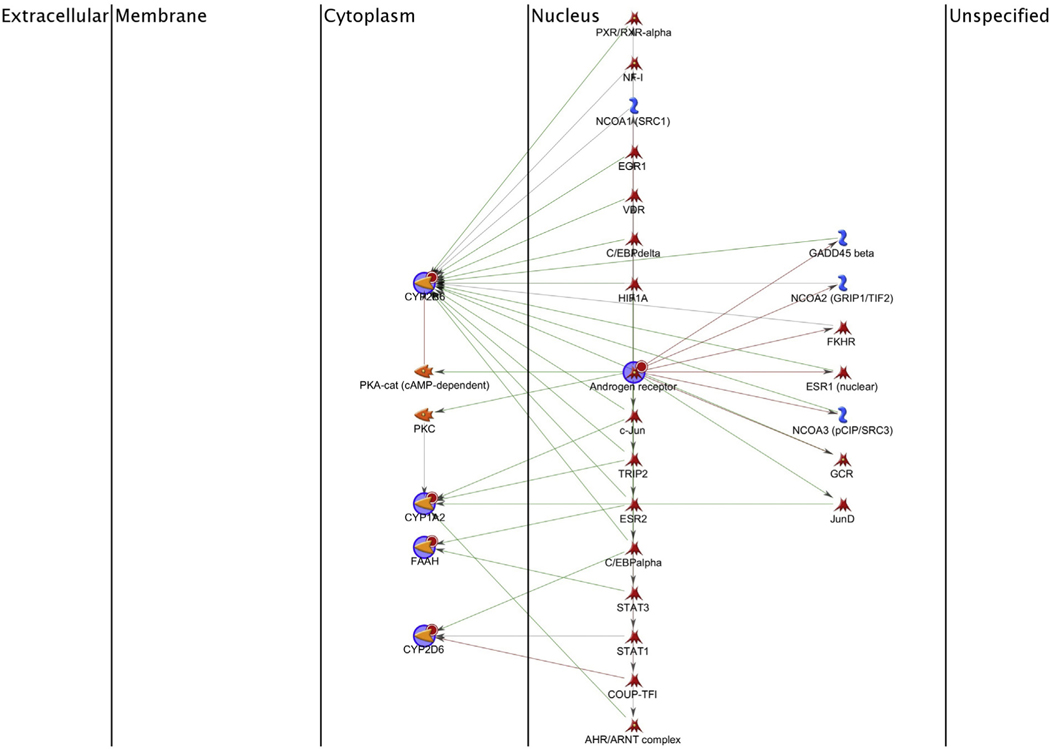
Fig. 3.
Proposed shortest paths network for potential genes associated to carbaryl. Green arrows = activating interactions; red arrows = inhibiting interactions. Large blue circles represent the genes that are the seed nodes the shortest paths algorithm was required to go through. Small red circles next to the genes indicate the targets of carbaryl. Catalytic factors = yellow; transcription factors = red; cytokines and lipoproteins = green; receptors and adaptor proteins = blue. (For interpretation of the references to colour in this figure legend, the reader is referred to the web version of this article.)

