
FIGURE 2.
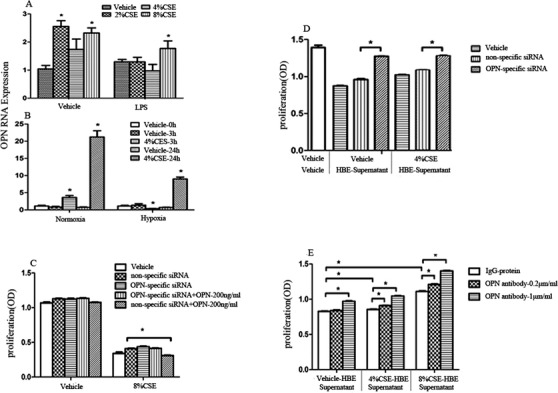
Validation of selected target OPN in cell models. OPN gene expression of human bronchial epithelial cells with vehicle and LPS (A) or with normoxia and hypoxia (B) after challenge with CSE at different concentrations and different times. The proliferation rates of cells treated with nonspecific siRNA or OPN‐specific siRNA with or without external OPN challenged with 8% CSE (C). The proliferation rates of U937 cells treated with supernatant from cellOPN− and cellOPN+ stimulated with CSE (D), or with co‐culture of external OPN with supernatants harvested from 4% and 8%‐stimulated cells for 24 h (E). Data are represented as mean ± SEM. Differences between groups were assessed by the Student's t‐test, after ANOVA analyses