
FIGURE 5.
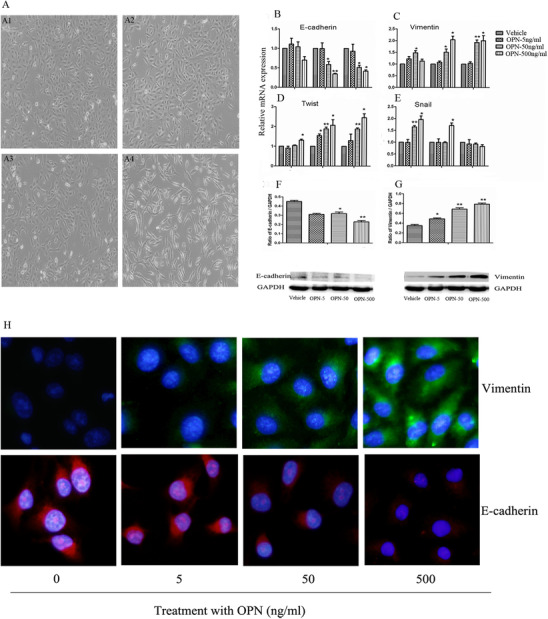
Validation of external OPN effects in lung cancer cell EMT. The epithelial morphology and growth pattern of A549 cells were observed 48 h after being treated with vehicle (A1) or OPN at 5, 50, or 500 ng/ml (A2, A3, or A4), respectively. The mRNA expression of E‐cadherin (B), vimentin (C), Twist (D), and Snail (E) was measured 24, 48, and 72 h after challenge with vehicle or external OPN protein at 5, 50, and 500 ng/ml, respectively. The expression of E‐cadherin (F) and vimentin (G) proteins was measured 48 h after OPN treatment at different doses, respectively, and stained by immune‐fluorescence staining (H). Data are represented as mean ± SEM. Differences between groups were assessed by the Student's t‐test, after ANOVA analyses. * and ** stand for p‐values less than .05 and .01, respectively, in comparison with vehicle