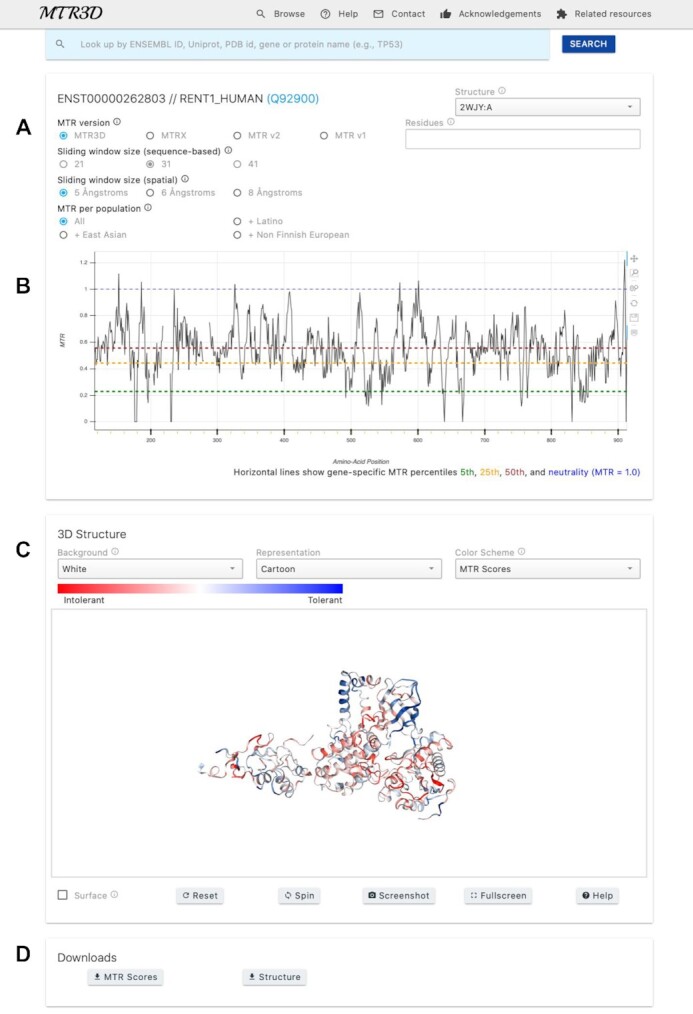
Figure 1.

MTR3D viewer page. (A) Users may select between different structures and sequence-based, spatial-based and consensus scores for the currently selected transcript. Users may also select between window sizes and population estimates. (B) Line graph showing the alignment of scores to the currently selected transcript and structure. Gaps in the plot indicate regions not congruent or not present in the protein tertiary structure. Horizontal lines indicate MTR percentiles for the current transcript at 5th, 25th, 50th and MTR = 1. (C) The selected protein structure is displayed and coloured by the currently selected MTR score, where red and blue represent intolerance and tolerance respectively. (D) Download links for the MTR scores for the currently selected structure or the currently shown PDB.
