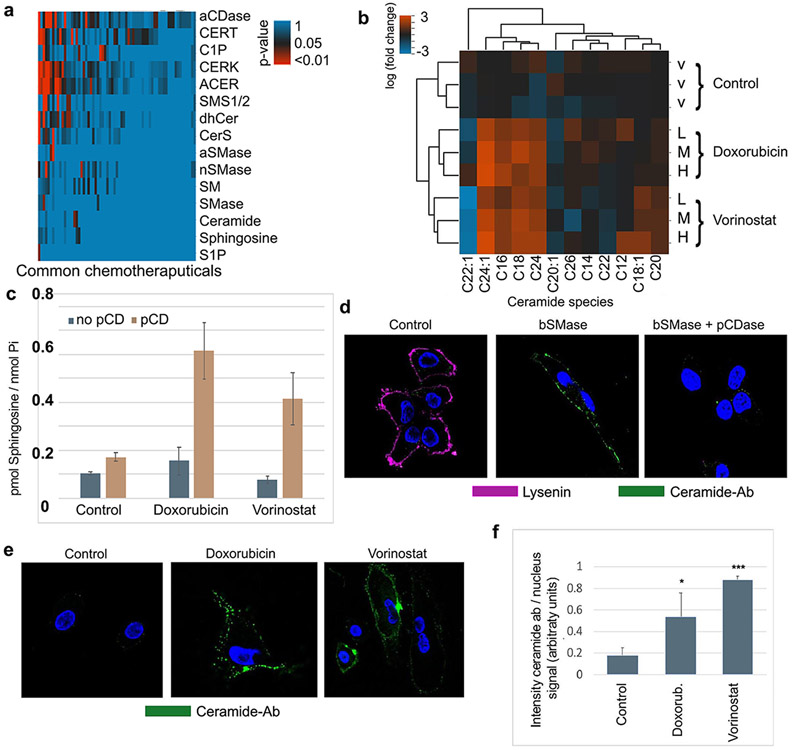
Fig 1. Selected chemotherapeutics induce plasma membrane ceramide.
(A) Text mining analysis using curated databases on NCBI literature (gene2pubmed and CTD database). Common chemotherapy compounds -x axis- were associated to sphingolipid terms -y axis-. Statistically significant relations between drugs and sphingolipid terms were plotted as adjusted p-values upon exact Fisher test analysis. P-values for doxorubicin/ceramide 0.00037, doxorubicin/nSMase2 0.040, vorinostat/ceramide 0.0443, vorinostat/nSMase2 0.0435 (B). Total cellular ceramide species were measured by mass spectrometry at 24h upon chemotherapeutic compounds treatment in HeLa cells. Natural logarithm of fold change versus control was plotted in a heatmap and clustered graphs. V-vehicle treatment (methanol). L-low doses (0.6 μM doxorubicin or 10 μM vorinostat), M-Medium doses (0.8 μM doxorubicin or 15 μM vorinostat), High doses (1 μM doxorubicin or 20 μM vorinostat). (C) Detection of ceramide at the plasma membrane by using recombinant pCDase to form sphingosine. Hydrolysis of plasma membrane ceramide to sphingosine is then measured by HPLC-mass spectrometry (see Methods). Doxorubicin and vorinostat did not induce sphingosine production, but when combined with pCDase, the levels of sphingosine dramatically increased, indicating formation of plasma membrane ceramide. (D) Validation of the anti-ceramide antibody. HeLa cells outer leaflet sphingomyelin and ceramide were stained with fluorescent-lysenin protein, which binds sphingomyelin (visualized in magenta), and with anti-ceramide antibody (visualized in green). Control cells (left panel) only showed lysenin but not ceramide staining. High doses of bSMase (100mU and 10 min) decreased lysenin staining and markedly increased cell staining with anti-ceramide antibody (middle panel). Treatment cells with 200mU pCDase reduced the ceramide staining (E) HeLa cells were treated with different chemotherapeutic compounds (doxorubicin 0.8uM and vorinostat 15uM) and stained using the anti-ceramide antibody. (F) Several images were quantified for anti-ceramide antibody showing statistical significance. Statistics one-way Anova Tukey post-test * p<0.05, *** p<0.001.

