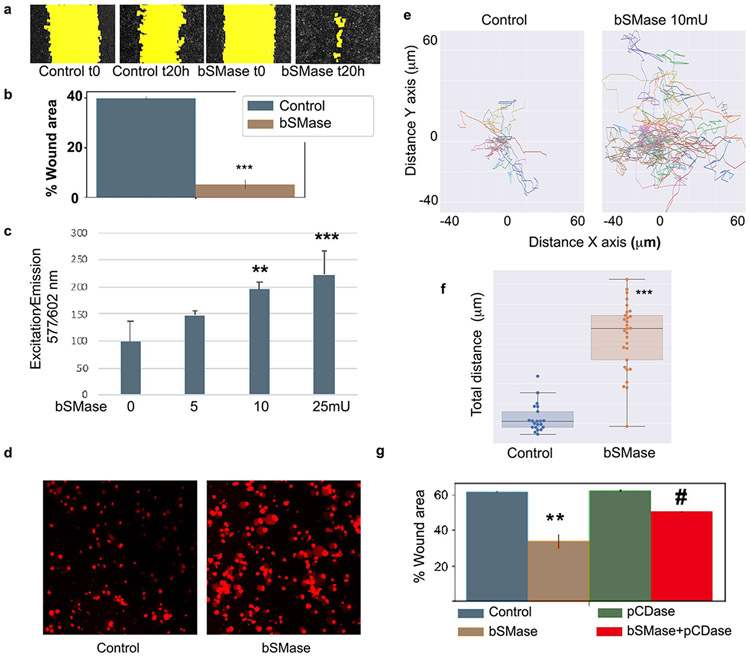
Figure 5. Generation of plasma membrane ceramide increases cell migration.
(A) Scratch wound healing migration assay in HeLa cells treated with bSMase was performed for 20h. Random images at time zero and after 20h are shown. Yellow color highlights the wound area. (B) quantification of independent experiments (n=10) showed that bSMase induced cell migration. Statistics t-test *** p<0.001. (C) Cell migration transwell using Fluoroblock. Different amounts of bSMase were added into the upper well for 2 min, washed and cells were left to migrate for 16h. Cells were stained with cell tracker and fluorescence was read from the bottom using a plate reader. Statistics one-way ANOVA Tukey posthoc vs bSMase 0 mU. (D) Random images of migrated cells stained with Red cell tracker, and visualized in a fluorescent microscopy. (E) Live imaging cell migration was performed in confocal dishes coated with fibronectin 1. Cells were plated at low confluency and low serum media. bSMase was added to plates for 2 min and images were taken every 15 min for 16h. Individual cell position was tracked using imaging processing software as detailed in methods. Individual cells tracks were plotted for qualitative view and (F) total distance for each individual cell was measured as the sum of the travelled distance each 15 min up to 16h. Student t-test *** p<0.001 (G) Scratch assay on cells treated with bSMase, pCDase and with the combination of both [bSMase+pCDase]. One-Way ANOVA Tukey post hoc test * p<0.01. # One-way ANOVA Tukey posthoc vs bSMase

