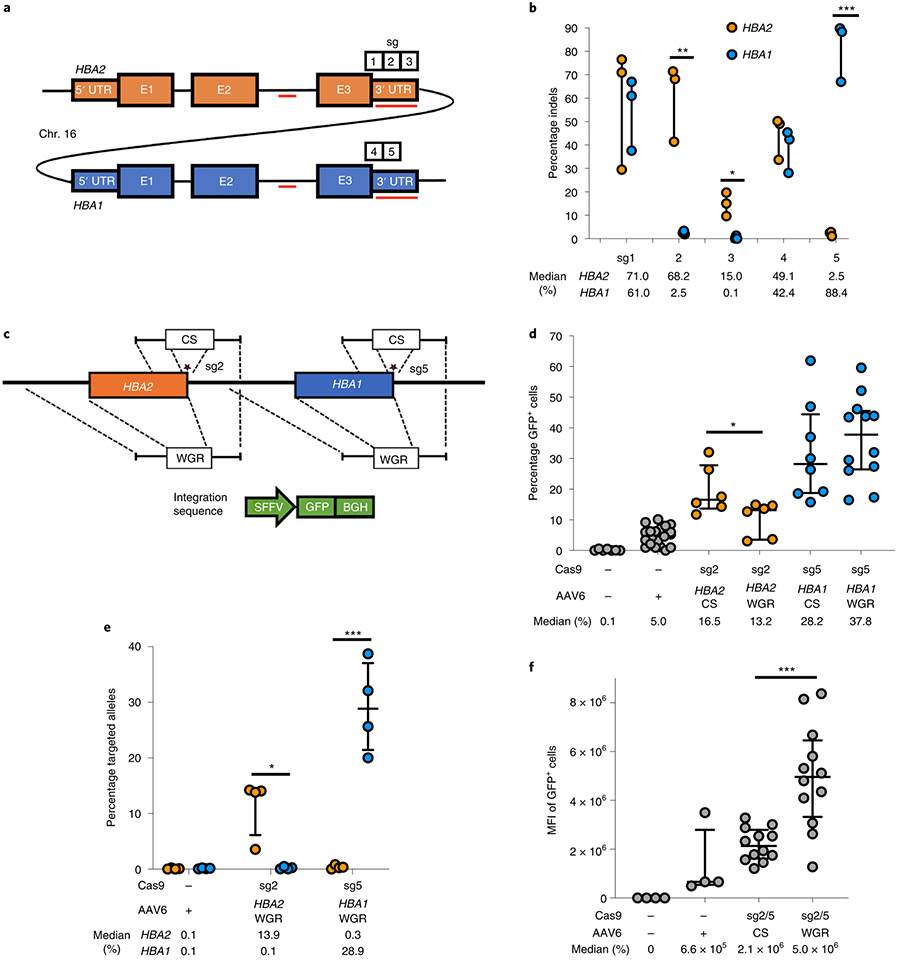
Fig. 1 ∣. sgRNA and AAV6 design for editing at the α-globin locus.
a, Schematic of HBA2 and HBA1 gDNA. Sequence differences between the two genes are depicted as red lines. Locations of the five prospective sgRNAs are indicated. b, Indel frequencies for each guide at HBA2 and HBA1 in human CD34+ HSPCs are depicted in orange and blue, respectively. Bars represent median ± interquartile range. n = 3 for each treatment group. *P = 0.0083, **P = 0.0037, ***P = 0.00042 by unpaired two-tailed t-test. c, AAV6 DNA repair donor design schematics for the introduction of a SFFV-GFP-BGH integration are depicted at HBA2 and HBA1 loci. Stars denote Cas9 cleavage sites for sg2 and sg5 within HBA2 and HBA1, respectively. d, Percentage of GFP+ cells using HBA2- and HBA1-specific guides and CS and WGR GFP integration donors, as determined by flow cytometry. Bars represent median ± interquartile range. Values represent biologically independent HSPC donors: n = 7 for mock, n = 20 for AAV only, n = 6 for HBA2-editing vectors, n = 8 for HBA1 CS vector and n = 12 for HBA1 WGR vector. *P = 0.042 by unpaired two-tailed t-test. e, Targeted allele frequency at HBA2 and HBA1 by ddPCR for determination of whether off-target integration occurs at the unintended gene. Bars represent median ± interquartile range. n = 4 biologically independent HSPC donors for each treatment group. *P = 0.0052, ***P = 0.00039 by unpaired two-tailed t-test. f, MFI of GFP+ cells across each targeting event as determined by the BD FACS Aria II platform. Bars represent median ± interquartile range. n = 4 biologically independent HSPC donors for mock and AAV-only treatments, and n = 12 for CS and WGR treatment groups. ***P = 0.00026 by unpaired two-tailed t-test. E1–3, exons 1–3.

