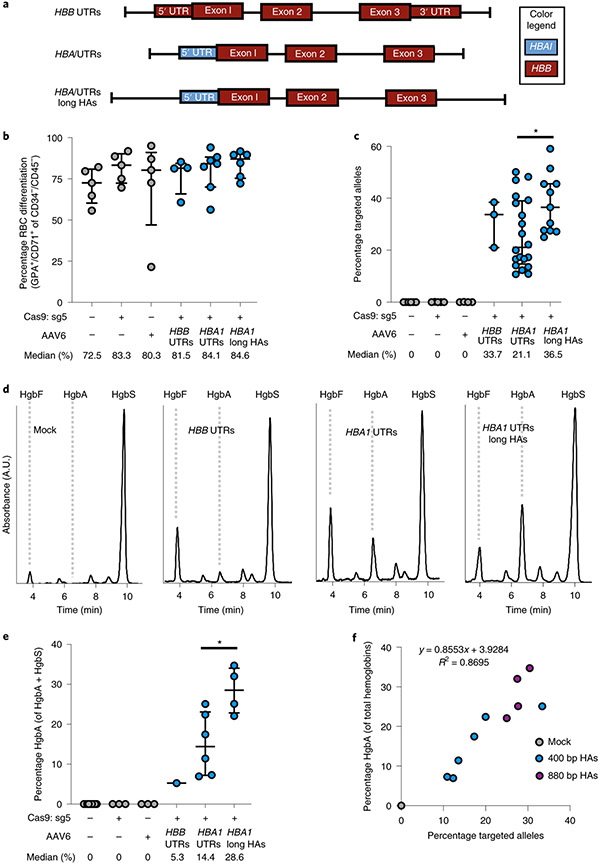
Fig. 3 ∣. WGR of α-globin with β-globin in SCD HSPCs.
a, AAV6 donor design for integration of a WGR HBB transgene at the HBA1 locus. b, Percentage of CD34−/CD45− HSPCs acquiring RBC surface markers—GPA and CD71—as determined by flow cytometry. Bars represent median ± interquartile range. Values represent biologically independent HSPC donors: n = 5 for mock, RNP only and AAV only; n = 4 for HBB UTRs; n = 7 for HBA1 UTRs; and n = 6 for HBA1 UTRs long HAs (HBA1 long HAs). c, Targeted allele frequency in bulk edited population at HBA1 as determined by ddPCR. Bars represent median ± interquartile range. Values represent biologically independent HSPC donors: n = 6 for mock, n = 5 for RNP only, n = 4 for AAV only, n = 3 for HBB UTRs, n = 20 for HBA1 UTRs and n = 11 for HBA1 UTRs long HAs. *P = 0.021 by unpaired two-tailed t-test. d, Representative HPLC plots for each treatment following targeting and RBC differentiation of human SCD CD34+ HSPCs. Retention times for HgbF, HgbA and HgbS tetramer peaks are indicated. e, Percentage HgbA of total hemoglobin tetramers. Bars represent median ± interquartile range. Values represent biologically independent HSPC donors: n = 9 for mock, n = 3 for RNP only and AAV only, n = 1 for HBB UTRs, n = 6 for HBA1 UTRs and n = 4 for HBA1 UTRs long HAs. *P = 0.019 by unpaired two-tailed t-test. f, Correlation between percentage HgbA and percentage targeted alleles in edited SCD HSPCs differentiated into RBCs and analyzed by HPLC. n = 11 biologically independent HSPC donors. A.U., arbitrary units.

