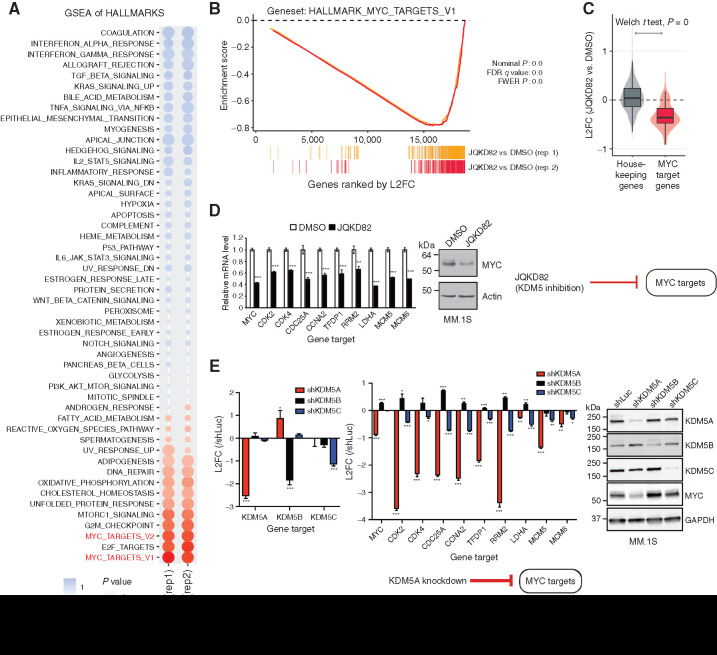
Figure 4.
Inhibition or knockdown of KDM5A downregulates expression of MYC-regulated genes. A, RNA-seq was performed on RNA extracted from MM.1S cells treated with 1 μmol/L of JQKD82 or DMSO control for 48 hours. GSEA for transcriptional hallmarks (Broad) summarized by a bubble plot is shown. Size of the bubbles indicates significance from nominal P value, and the normalized enrichment score (NES) indicates the strength and direction of the enrichment. n = 2 independent treatments, RNA extractions, and RNA-seq reactions per group. B, GSEA plots for MYC target genes after treatment with JQKD82 in MM.1S cells, across two biological replicates. FWER, family-wise error rate. C, Direct comparison of log2 fold change (L2FC) in RNA expression from samples in A, for housekeeping genes (left) and MYC target genes (right), summarized by boxplots and violin distributions. Comparison by Welch t test resulted in highest significance, P = 0. D, Expression levels of representative MYC target genes were assessed by quantitative real-time PCR after treatment with 1 μmol/L of JQKD82 or DMSO control for 48 hours in MM.1S cells (left). Data are normalized against the housekeeping control gene RPLP0. Theexpression relative to DMSO (control) is shown as mean ± SD of triplicate measurements. **, P < 0.01; ***, P < 0.001 compared with control; unpaired Student t test. Immunoblot analysis for MYC and actin (loading control) after treatment with JQKD82 at 1 μmol/L or DMSO for 48 hours in MM.1S cells (right).E, Expression levels of representative MYC target genes were assessed by quantitative real-time PCR after transduction of shKDM5A, shKDM5B, or shKDM5C in MM.1S cells (left). Data are normalized against the housekeeping control gene RPLP0. The expression relative to shLuc (log2 fold change) is shown as mean ± SD of triplicate measurements. *, P < 0.05; **, P < 0.01; ***, P < 0.001 compared with shLuc (control); unpaired Student t test. Immunoblot analysis for KDM5A, KDM5B, KDM5C, MYC, and GAPDH (loading control) after transduction of shKDM5A, shKDM5B, shKDM5C, or shLuc in MM.1S cells (right).

