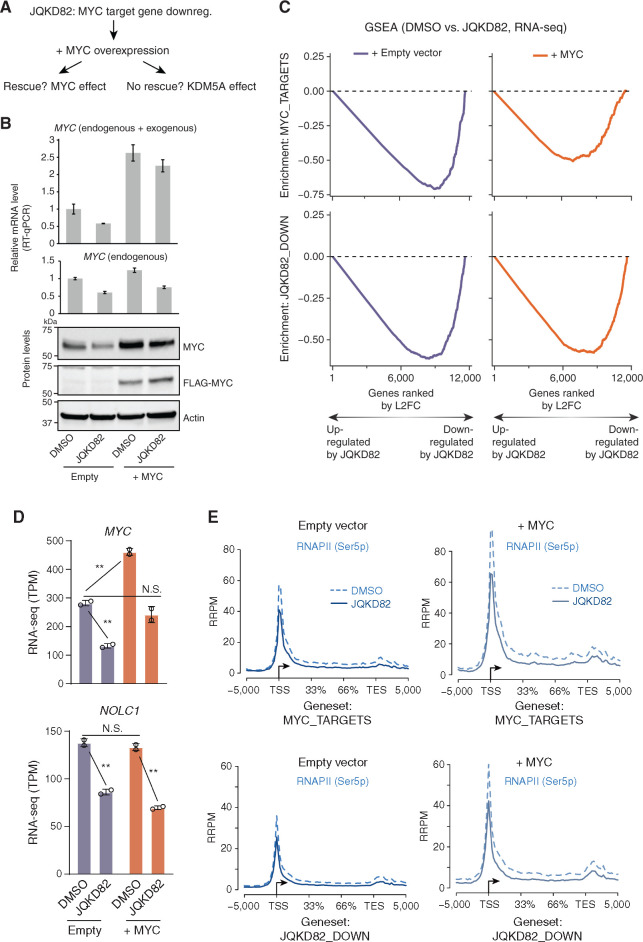
Figure 7.
Dissecting the requirement of MYC and KDM5A for transcription and RNAPII phosphorylation of JQKD82-sensitive genes. A, Framing the question: Is the effect of JQKD82 on downregulating MYC targets an indirect effect that can be rescued by MYC overexpression, or do MYC target genes require KDM5A even in the presence of supraphysiologic levels of MYC? B, FLAG-tagged MYC or empty vector was overexpressed in MM.1S cells. Expression level of MYC measured by quantitative real-time PCR (RT-qPCR; top) and by immunoblot (bottom) compared to cells with empty vector after treated with DMSO or 1 μmol/L of JQKD82 for 48 hours. MYC quantitative real-time PCR results are normalized against RPLP0 as a housekeeping control. For detecting both endogenous and exogenous MYC, the primers target only the CDS region (top). For detecting only endogenous MYC, the primers target the region including 5′UTR because exogenous MYC does not include 5′ UTR of the MYC gene (bottom). The expression relative to DMSO-treated empty vector control is shown as mean ± SD of triplicate measurements. C, MM.1S cells were treated as in B, and RNA was extracted for RNA-seq analysis. This was then used to perform GSEA of MYC targets (top) and JQKD82-sensitive genes (bottom). Gene-level quantification was ERCC spike-in normalized on a per-cell basis to adjust for changes in total RNA per cell. Changes in expression upon JQKD82 treatment were quantified and ranked by log2 fold change (L2FC, of transcripts per million), and enrichment scores were generated using the GSEA desktop software package. Gene expression changes were evaluated in this way from MM.1S cells with either empty vector (purple) or MYC overexpression vector (orange). n = 2 independent biological replicates per condition. D, RNA-seq from MM.1S cells for MYC and NOLC1 genes in TPM (transcripts per million) comparing DMSO versus JQKD82 treatment in the cellular context of either empty vector versus MYC overexpression. Error bars represent the SD across two independent biological replicates. N.S., P > 0.1; **, P < 0.005, unpaired Student t test. E, RNAPII (Ser5p) ChIP-seq with exogenous reference genomes (ChIP-Rx) from MM.1S cells with either empty vector (left two panels) or MYC overexpression vector (right two panels), viewed at both MYC target genes (top two panels) and JQKD82-sensitive genes (bottom two panels). Dotted lines indicate metagene signal from DMSO-treated cells, and solid lines indicate metagene signal from JQKD82-treated cells.

