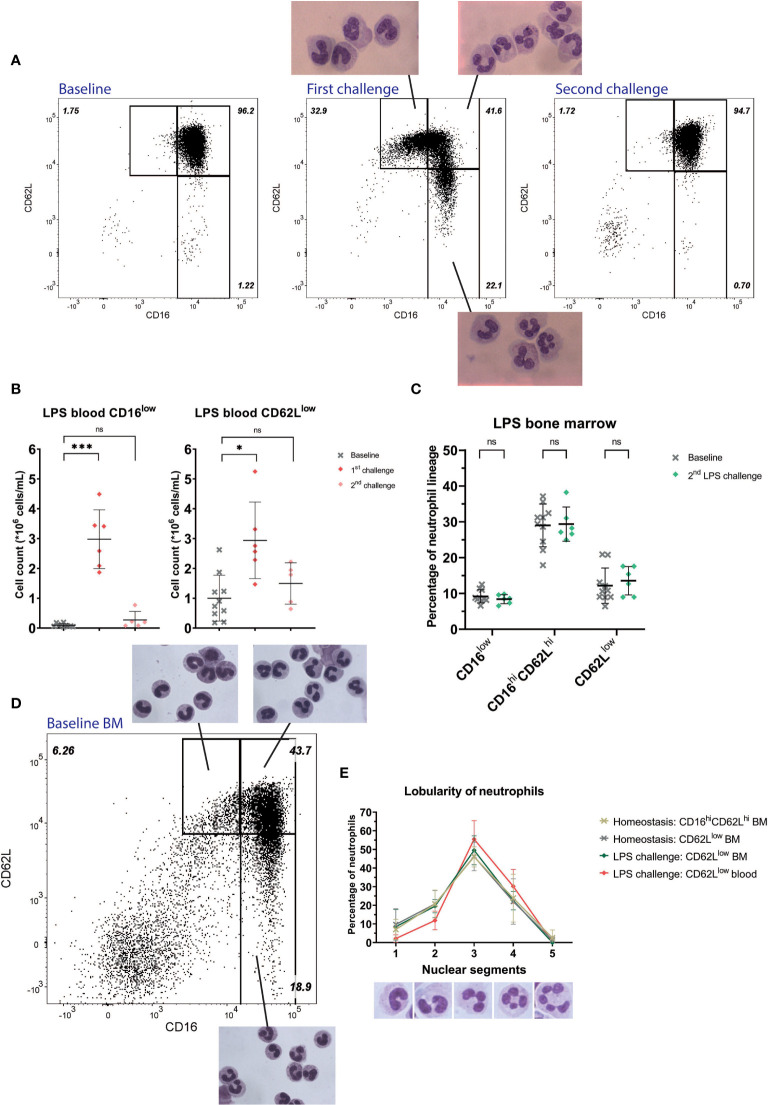
Figure 1.
Healthy volunteers undergoing LPS challenge. Representative FACS examples of CD16/CD62L plots of blood from a healthy subject at baseline (first panel), 4 hours after the first LPS challenge with corresponding cell morphology of the specific subsets (second panel) and 4 hours after the second LPS challenge (third panel) (A). Cell counts of CD16low neutrophils (first graph) and CD62Llow neutrophils (second graph) at baseline (n=10), after the first (n=6) and second (n=5) LPS challenge. Lines are means with SD. A one-way ANOVA analysis (paired) with a post-hoc Dunnett’s multiple comparisons test was used to test significance (B). Percentages of neutrophil subsets in bone marrow (BM) and after the second LPS challenge. Lines are means with SD. A two-way ANOVA analysis (paired) with a post-hoc Sidak’s multiple comparisons test was used to test significance (C). Representative FACS example of CD16/CD62L plot of bone marrow from a healthy volunteer at baseline with the corresponding cellular morphology for the different subsets (D). Percentages of nuclear lobes of CD62Llow neutrophils (ranging from 1 to 5) during homeostasis in bone marrow and during LPS challenge in bone marrow and blood. Lines are means with SD (E). Significance is displayed in graphs as ns, not significant, P* ≤ 0.05 or P***≤ 0.001.

