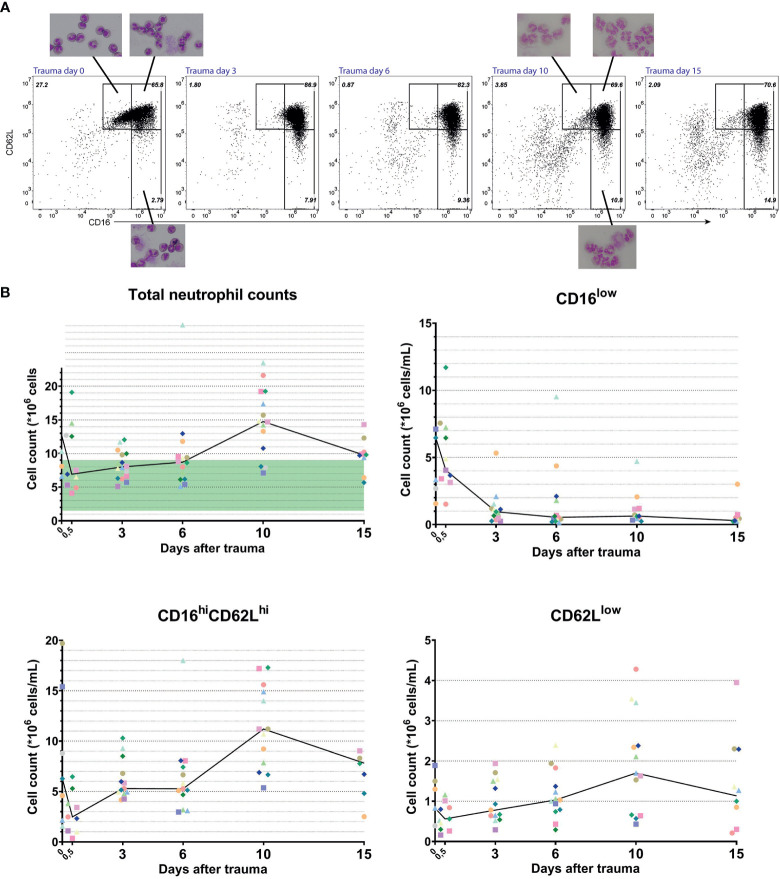
Figure 3.
Longitudinal data from multitrauma patients. Representative FACS examples of CD16/CD62L plot of blood from a multitrauma patient. From left to right: at admission (day 0), 3 days, 6 days, 10 days and 15 days after admission to the hospital (A). Kinetics of cell counts over time of all circulating neutrophils (upper left panel), CD16low neutrophils (upper right panel), mature CD16high/CD62Lhigh neutrophils (lower left panel) and CD62Llow neutrophils (lower right panel). Data from a unique individual is represented by a unique color. A line is plotted through the medians of every time point. In the upper left panel, the normal range of blood counts for neutrophils is marked by a green area ranging from 1,5 to 9*106 cells/mL (B).

