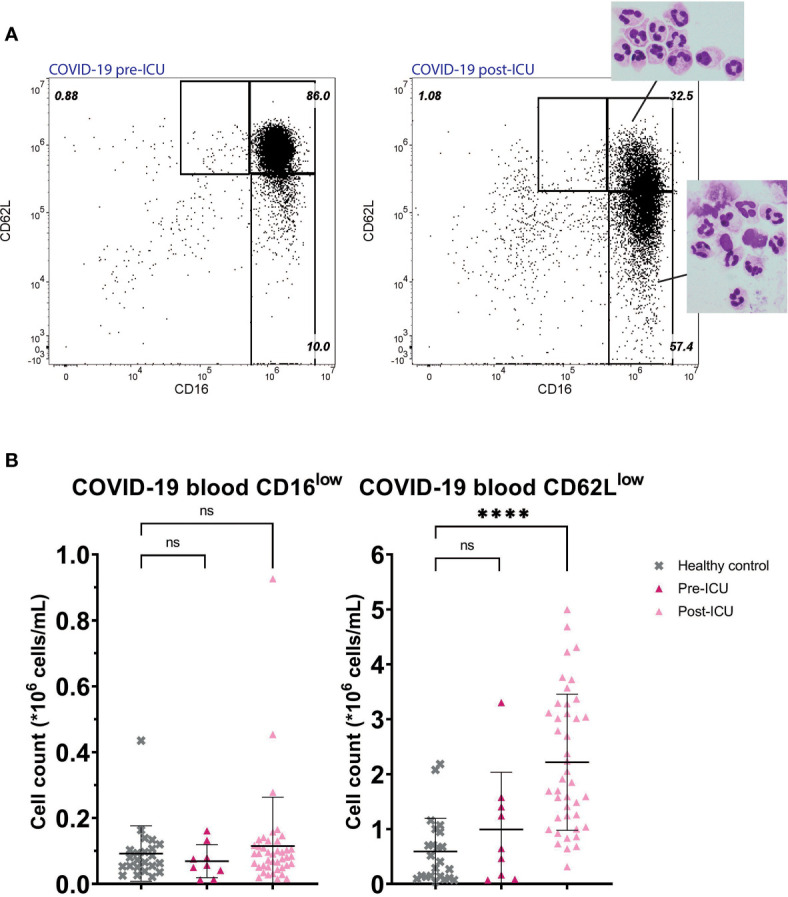
Figure 4.

COVID-19 patients pre- and post-ICU. Representative FACS examples of CD16/CD62L plot of blood from a hospitalized COVID-19 patient before admission to the ICU (left panel) and from the same patient post-ICU with corresponding nuclear morphology of the subsets (right panel) (A). Cell counts of CD16low neutrophils (left panel) and CD62Llow neutrophils (right panel) in healthy control (HC) blood (n=23) and in blood from COVID-19 patients pre-ICU (n=9) and post-ICU (n=41) (B). Lines are means with SD. A one-way ANOVA analysis (unpaired) with a post-hoc Dunnett’s multiple comparisons test was used to test significance. Significance is displayed in graphs as ns, not significant, P**** <0,0001.
