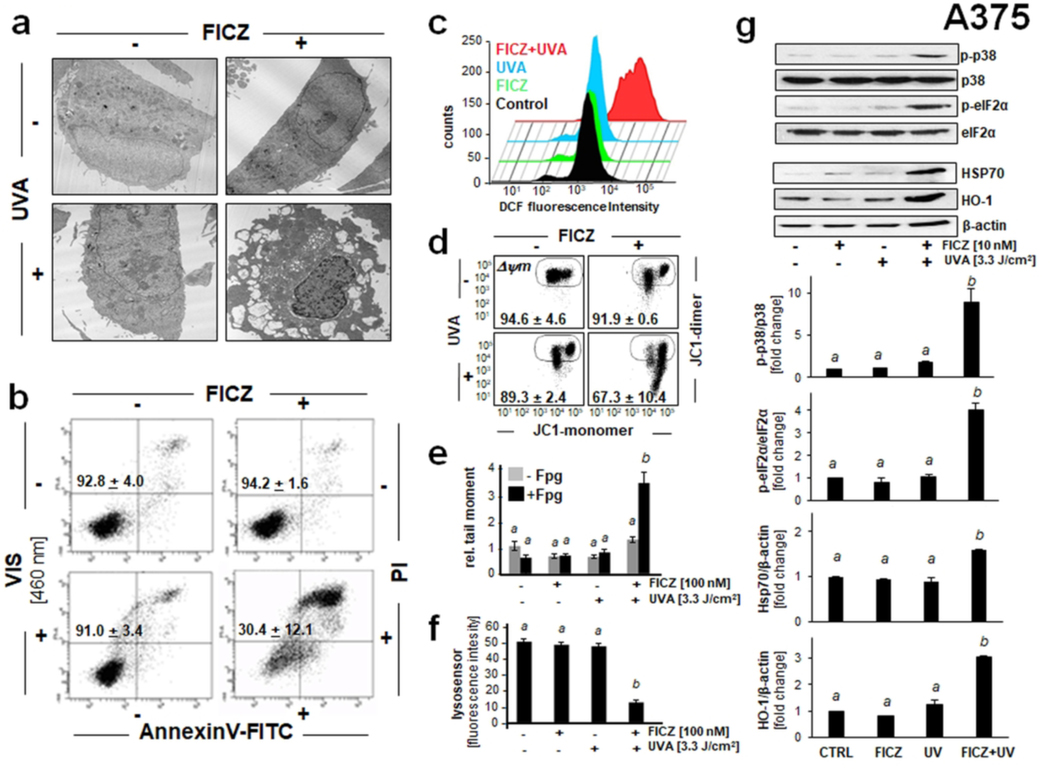
Figure 5. Photodynamic induction of stress response gene expression in A375 malignant melanoma cells exposed to the combined action of UVA and FICZ.
(a) Transmission electron microscopy (fold magnification: x 2,650) 6 h after FICZ-PDT (FICZ 100 nM; UVA 3.3 J/cm2). (b) Cells exposed to FICZ [10 nM] and blue light [LED 460 nm, 2.5 J/cm2]. Flow cytometric analysis of annexinV-FITC/propidium iodide (PI)-stained cells [24 h; n=3, mean ± SEM]. (c) Induction of cellular oxidative stress as examined 1 h after FICZ-PDT (conditions as in A) using flow cytometric analysis of DCF-DA stained cells. A representative experiment (out of at least three representative repeats) is displayed. (d) Loss of mitochondrial transmembrane potential (Δψm) as assessed by flow cytometric analysis of JC-1 stained cells, 1 h after FICZ (10 nM)/UVA (3.3 J/cm2) treatment. Numbers indicate percentage of cells inside the circle displaying intact Δψm [n=3, mean ± SD; (p<0.05)]. (e) Fpg-enhanced comet assay [FICZ: 100 nM; UVA: 3.3 J /cm2; 1 h] as performed in Fig. 4b. Bar graph displays relative comet tail moment [n=50 per group; mean ± SEM]. (f) FICZ-PDT-induced lysosomal impairment [FICZ 100 nM; UVA 3.3 J/cm2; 1 h] detected by LysoSensor green fluorescence microscopy [scale bar: 200 μm, 40 μm (overlay); n=85, mean ± SEM]. Bar graph displays quantitative analysis of LysoSensor fluorescence intensity [n=85, mean ± SEM]. (g) Cellular stress response induced by FICZ-UVA [FICZ 10 nM; UVA 3.3 J/cm2; top panel: 1h after irradiation; bottom panel: 6 h after irradiation] as determined at the protein level (immunoblot analysis; n≥3). For bar graph depiction, quantitative data analysis employed ANOVA with Tukey’s post hoc test; means without a common letter differ from each other (p<0.05).

