

Abstract
Abnormal levels of glutathione, a cellular antioxidant, can lead to a variety of diseases. We have constructed a near-infrared ratiometric fluorescent probe to detect glutathione concentrations in biological samples. The probe consists of a coumarin donor, which is connected through a disulfide-tethered linker to a rhodamine acceptor. Under the excitation of the coumarin donor at 405 nm, the probe shows weak visible fluorescence of the coumarin donor at 470 nm and strong near-infrared fluorescence of the rhodamine acceptor at 652 nm due to efficient Forster resonance energy transfer (FRET) from the donor to the acceptor. Glutathione breaks the disulfide bond through reduction, which results in a dramatic increase in coumarin fluorescence and a corresponding decrease in rhodamine fluorescence. The probe possesses excellent cell permeability, biocompatibility, and good ratiometric fluorescence responses to glutathione and cysteine with a self-calibration capability. The probe was utilized to ratiometrically visualize glutathione concentration alterations in HeLa cells and Drosophila melanogaster larvae.
Graphical Abstract
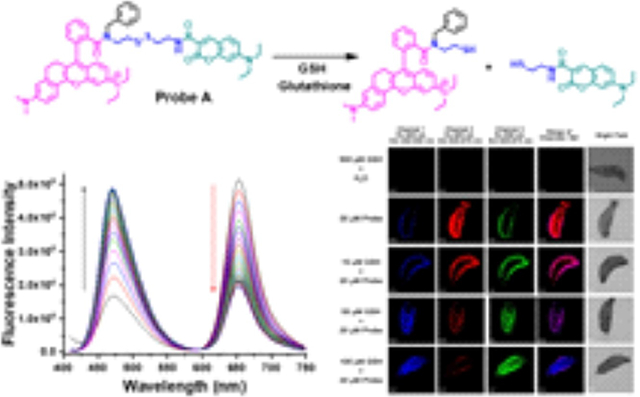
A probe based on a coumarin donor and a near-infrared rhodamine acceptor linked via a disulfide-tethered bond has been developed for ratiometric visualization of glutathione in live cells and Drosophila melanogaster larvae through modulation of efficient Forster resonance energy transfer (FRET) from the donor to the acceptor.
Introduction
Glutathione (GSH) serves as a crucial endogenous antioxidant agent in live cells and plays an important role in maintaining the normal redox status through the removal of reactive oxygen species.[1] Abnormal GSH levels are often associated with diseases, such as AIDS and cancer.[2] Therefore, it is very important to precisely detect GSH levels in order to understand physiological and pathological processes.[3] Many fluorescent probes for biothiol detection have been developed with different sensing mechanisms.[3b,4] These include photo-induced electron transfers,[4a,b,j,5] addition reactions with selectivity of glutathione over cysteine,[6] removal of a heavy atom fluorescence quenching effect by halogen nucleophilic substitution,[7] intramolecular charge transfer,[8] and FRET.[4b,c,9] Among these different sensing approaches, FRET-based ratiometric fluorescent probes possess unique advantages with self-calibration capabilities.[9,10] Systematic errors, which are characteristic of intensity-based fluorescent probes resulting from fluctuations in the excitation light source, sample heterogeneity, uneven dye distribution, variations, and compartmental localization, do not occur with ratiometric probes.[10,11] However, FRET-based fluorescent probes for GSH detection are the least developed among the GSH probes.[3b,4a–c,11b] For this reason, we developed a FRET-based ratiometric GSH detection probe consisting of a coumarin donor and a rhodamine acceptor, connected through a disulfide-tethered linkage (Scheme 1). Upon excitation at wavelengths below the coumarin absorbance, the probe fluoresces strongly from the rhodamine acceptor and weakly from the coumarin donor due to an efficient donor-acceptor energy transfer through a FRET mechanism. However, adding GSH cleaves the disulfide bond in the probe, forming thiols and glutathione disulfide. This reaction reduces the donor-to-acceptor energy transfer and results in ratiometric responses of the probe to GSH, resulting in a decrease of the rhodamine near-infrared fluorescence and an increase in the coumarin fluorescence. Our fluorescent probe displays low cytotoxicity, excellent cell permeability, and can detect GSH concentration changes in live cells and Drosophila melanogaster (D. melanogaster) larvae. The response is selective for glutathione over other amino acids, except for cysteine, where a less pronounced effect was noted.
Scheme 1.
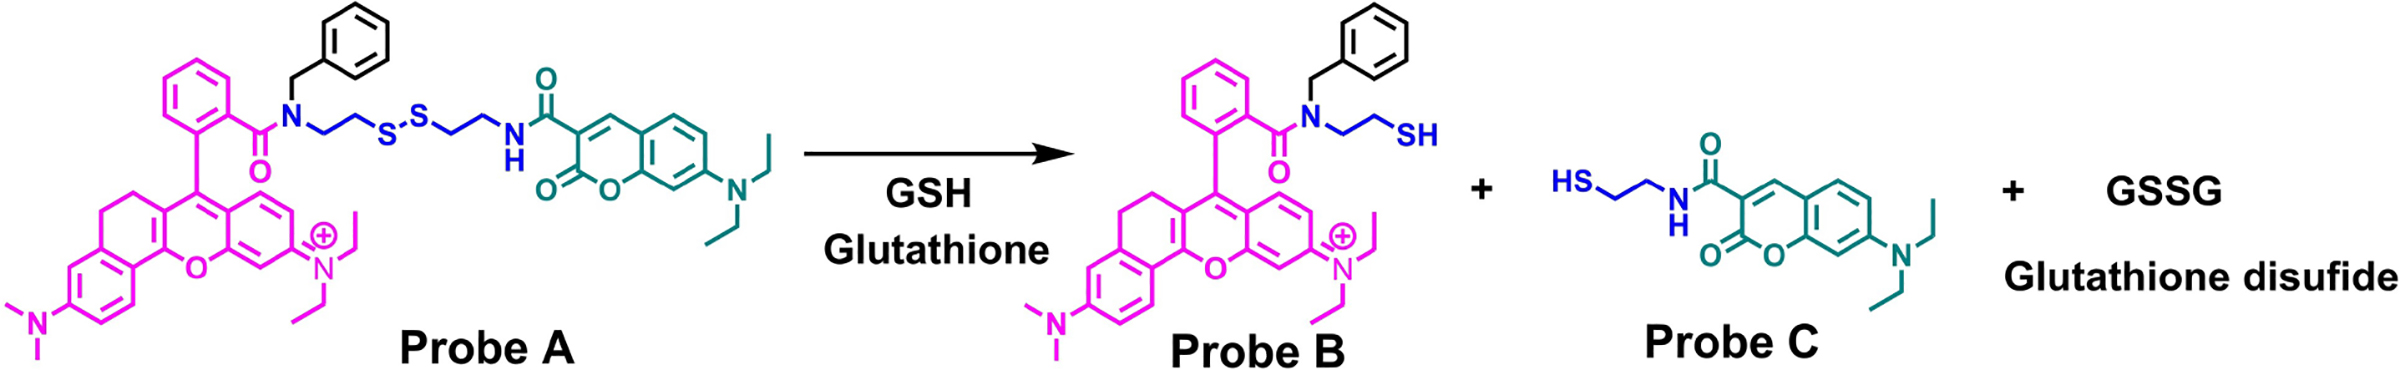
Chemical structural response of probe A to glutathione.
Experimental Section
Materials
Unless specifically indicated, all reagents were obtained from commercial suppliers.
Synthesis of compound 6
A mixture of tert-butyl (2-((2-aminoethyl)disulfaneyl)ethyl) carbamate (2) (2.5 g, 10 mmol),[12] benzaldehyde (3) (1.1 g, 10 mmol), anhydrous Na2SO4 (1.4 g, 10 mmol) in anhydrous methylene chloride were stirred overnight at room temperature, and the solvent was removed under reduced pressure. After the corresponding residue (imine) was dissolved in methanol (50 mL), NaBH4 (190 mg, 5 mmol) was added in portions at 0°C. The solution was stirred at room temperature for at least 5 hours. The solvent was removed under reduced pressure, followed by the addition of 50 mL of methylene chloride to the residue. The resulting solution was washed three times with 50 mL water. The organic phase was collected, dried over anhydrous MgSO4, and concentrated under reduced pressure to yield tert-butyl(2-((2-(benzylamino)ethyl) disulfaneyl)ethyl)carbamate (4), which was utilized without further purification for the next reaction.[13] A mixture of compound 4 (328 mg, 1 mmol), near-infrared rhodamine dye (5)[14] (467 mg, 1 mmol), BOP reagent (530 mg, 1.2 mmol), and triethylamine (1 mL) in anhydrous methylene chloride was stirred overnight at room temperature. The product was washed with brine thrice. The organic layer was collected, dried over anhydrous Na2SO4, filtered, and concentrated under reduced pressure. The residue was purified by flash column chromatography through a gradient elution process with dichloromethane/methanol (30:1) to yield compound 6 as a blue solid. 1H NMR (400 MHz, chloroform-d) δ 8.18 (dd, J= 11.9, 9.3 Hz, 1H), 7.64–7.55 (m, 2H), 7.51 (s, 1H), 7.24 (dd, J=7.8, 4.5 Hz, 2H), 7.02 (dd, J=13.5, 9.2 Hz, 2H), 6.97–6.91 (m, 1H), 6.91–6.86 (m, 1H), 6.78 (dd, J=21.3, 16.9, 6.6 Hz, 3H), 6.53–6.38 (m, 2H), 3.58–3.45 (m, 4H), 3.33 (q, J=6.5, 6.1 Hz, 2H), 3.17 (d, J=7.2 Hz, 6H), 3.02–2.90 (m, 2H), 2.88–2.71 (m, 4H), 2.60 (dd, J=27.3, 13.2, 6.6 Hz, 3H), 2.49–2.37 (m, 2H), 1.38 (d, J=14.2 Hz, 9H), 1.26 (q, J=6.8 Hz, 6H). 13C NMR (100 MHz, chloroform-d) δ 169.59, 164.93, 156.41, 155.77, 154.95, 153.53, 146.38, 136.11, 135.77, 130.01, 129.89, 129.06, 128.61, 127.85, 126.88, 120.61, 120.40, 114.86, 114.01, 112.57, 110.83, 96.43, 53.81, 47.23, 45.84, 40.71, 39.78, 28.69, 28.16, 24.86, 12.82, 12.77.
Synthesis of probe A
After compound 6 was stirred in a solvent mixture consisting of 5 mL TFA and 5 mL methylene chloride for 2 hours, the solvents were removed under reduced pressure. The residue was dissolved in 50 mL of methylene chloride and washed twice with saturated NaHCO3. The organic layer was collected, dried over anhydrous MgSO4, and concentrated under reduced pressure to yield compound 7, which was used without further purification for the next reaction. Compound 7 (346 mg, 0.5 mmol), 7-(diethylamino)-2-oxo-2H-chromene-3-carboxylic acid (8) (130 mg, 0.5 mmol), BOP reagent (265 mg, 0.6 mmol), triethylamine (0.5 mL) in anhydrous CH2Cl2 were stirred overnight at room temperature. After the mixture was washed (first with water and then with brine), the organic layer was collected, dried over anhydrous Na2SO4, filtered and then evaporated under reduced pressure. The resulting product was purified by flash column chromatography under gradient elution with dichloromethane/methanol (20:1) to yield probe A as a blue solid. 1H NMR (400 MHz, chloroform-d) δ 8.98 (d, J=31.2 Hz, 1H), 8.72–8.52 (m, 1H), 8.22 (dd, J=52.3, 9.4 Hz, 1H), 7.65–7.55 (m, 3H), 7.40 (d, J=8.6 Hz, 1H), 7.24 (s, 3H), 7.04 (d, J=8.6 Hz, 2H), 6.96 (s, 2H), 6.82 (d, J=9.2 Hz, 1H), 6.74 (d, J=6.8 Hz, 1H), 6.65 (s, 1H), 6.46 (s, 2H), 3.54 (s, 7H), 3.50–3.38 (m, 8H), 3.18 (d, J=18.1 Hz, 6H), 2.72 (d, J=32.7 Hz, 4H), 1.25–1.18 (m, 12H).13C NMR (101 MHz, chloroform-d) δ 169.48, 167.43, 164.95, 156.58, 155.64, 154.93, 153.56, 149.76, 136.72, 135.87, 135.28, 131.80, 130.32, 129.90, 129.15, 128.59, 127.99, 126.94, 126.07, 125.59, 124.46, 120.17, 116.52, 114.83, 113.97, 112.61, 110.76, 105.48, 96.51, 53.06, 45.84, 43.55, 40.82, 40.69, 39.76, 38.74, 34.90, 28.02, 24.78, 12.84.
Cell culture and MTT assay
HeLa cells were purchased from ATCC (Manassas, VA), and 35 mm glass-bottom confocal dishes from MatTeck (Ashland, MA) were used to perform confocal microscopy imaging. The HeLa cells were incubated at 37°C with 5% of carbon dioxide in an Eppendorf Galaxy 170R CO2 incubator (Hauppauge, NY). The cells were subcultured typically every other day, and small quantities of trypsin-EDTA solution (ca. 2 mL of a 0.25% solution) from Thermo Fisher Scientific (Waltham, MA) were added to dissociate the cells attached to the cell culture plate. For the MTT assay, the HeLa cells were seeded at a density of about 6,000 cells per well in a 96-well plate, grown for 24 hours, followed by the addition of fresh culture medium containing probe A of different concentrations (0, 5, 10, 15, 25 to 50 μM), followed by further incubation of 48 hours. The cells were then incubated for 4 hours with 500 μg/mL of tetrazolium salt (3-(4,5-dimethylthiazol-2-yl)-2,5-diphenyl tetrazolium bromide). Metabolically active cells changed this yellow salt to purple formazan, which is water-insoluble. The purple crystals were then dissolved in DMSO to determine cell viability through an absorbance measurement at 490 nm. We used the formula Vrate= (A–AB)/(AC–AB)×100% to measure the cell survival rate. A is the absorbance of the experimental group, AC the absorbance of the control (cells in normal medium), and AB equals the absorbance of the blank (no cells).
Confocal imaging of HeLa cells
HeLa cells were seeded in dishes for 24 hours, which resulted in the cells attached to the dish. Various agents and the probes were then subsequently added.[15] The cells were washed three times with phosphate-buffered saline (PBS) before obtaining the image with an Olympus IX 81 confocal microscope (San Jose, CA). The coumarin donor of probe A was excited at 405 nm to collect visible emission of the donors from 450 nm to 500 nm and near-infrared emission of the acceptors from 625 nm to 675 nm. The rhodamine acceptor was excited at 559 nm to collect the acceptor near-infrared emission from 625 nm to 675 nm. For the co-localization study of probe A in live cells, the near-infrared dye IR-780 was excited at 635 nm to monitor near-infrared emissions from 750 nm to 800 nm.
In vivo tests with D. melanogaster larvae
A 9-well glass viewing dish was utilized to test probe A in first-instar D. melanogaster larvae. Each treatment contained 10 freshly hatched larvae. First, for the GSH-only control, larvae were incubated in 500 μL of 500 μM GSH for two hours, washed thrice in 500 μL of distilled water, submerged for five hours in distilled water, and washed thrice with deionized water. Next, for the probe-only control, larvae were incubated in 500 μL of deionized water for two hours, washed thrice in 500 μL of distilled water, submerged for five hours in 20 μM probe, and washed thrice with deionized water. Another well consisted of larvae that were incubated in 500 μL of 50 μM GSH for two hours, washed thrice in 500 μL of distilled water, submerged for five hours in 20 μM probe, and washed thrice with deionized water. Further, larvae were incubated in 500 μL of 100 μM GSH for two hours, washed thrice in 500 μL of deionized water, submerged for five hours in 20 μM probe, and washed thrice with deionized water. Finally, larvae were incubated in 500 μL of 500 μM GSH for two hours, washed thrice in 500 μL of deionized water, submerged for five hours in 20 μM probe, and washed thrice with deionized water. After the final washing, the larvae were mounted in wash water between a microscope slide and a coverslip. The larvae were analyzed using identical conditions as those used in the HeLa cell imaging test.
Theoretical calculations
Models suitable for the calculations for probe A and its derived parts, B and C, were obtained as described previously,[16] using Chem3d with MM2 minimization of energies,[17] followed by force field (UFF) calculations in Avogadro.[18] The molecular data were refined using density functional theory (DFT), using the APFD functional[19] and electron basis sets initially at the 6–31+g(d) level to convergence in Gaussian 16.[20] Imaginary frequencies were not obtained in any frequency calculations. The excited states were assessed based on TD-DFT optimizations[21] in a Polarizable Continuum Model (PCM) of water[22] with 6–31+g(d,p) basis sets for probe A and 6–311+(d) for B and C. Results were interpreted using GaussView 6[23] for all data and figures. Calculations on the molecules listed in Table 1 were conducted at the MO62X functional[24] and with 6–31+g(d,p) basis sets. The results of the calculations are outlined in the Supporting Information.
Table 1.
Calculated thermal energies of cysteine, dithiothreitol, glutathione, and homocysteine and their respective coupled products.
| Acid | Thermal Energies [kcal/mol] | Difference [kcals/mol] |
|---|---|---|
| Cysteine (CYS) | 73.488 | 9.674 |
| CYS2 | 137.302 | |
| Dithiothreitol (DTT) | 96.235 | 11.813 |
| DTT2 | 84.422 | |
| Glutathione (GSH) | 198.315 | 9.357 |
| GSH2 | 387.273 | |
| Homocysteine (HCY) | 92.275 | 9.702 |
| HCY2 | 174.848 | |
Results and Discussion
Probe design and synthesis
We conjugated a FRET coumarin donor to a near-infrared rhodamine acceptor through a disulfide-tethered linker. The rationale was that this bond will be ruptured by GSH to trigger ratiometric fluorescence responses to GSH by preventing effective fluorescence resonance energy transfer from the donor to the acceptor.[11b,25] In order to prevent the formation of a spirolactam switch in the near-infrared rhodamine acceptor (5),[15b,c,26] we used the secondary amine of disulfide derivative (4) which was obtained by reacting benzaldehyde (3) with tert-butyl (2-((2-aminoethyl)disulfaneyl)ethyl)carbamate (2) and then reducing the imine derivative with sodium borohydride in a methanol solution at room temperature. A near-infrared rhodamine dye was conjugated to one terminal of disulfide derivative (4) through an amide bond resulting in compound (6). The FRET-based fluorescent probe for GSH detection was prepared by removing the tert-butoxycarbonyl (Boc) protecting group with trifluoroacetic acid in methylene chloride, followed by coupling an amine group of rhodamine derivative (7) with the carboxylic acid-functionalized coumarin (8) via an amide bond (Scheme 2).
Scheme 2.
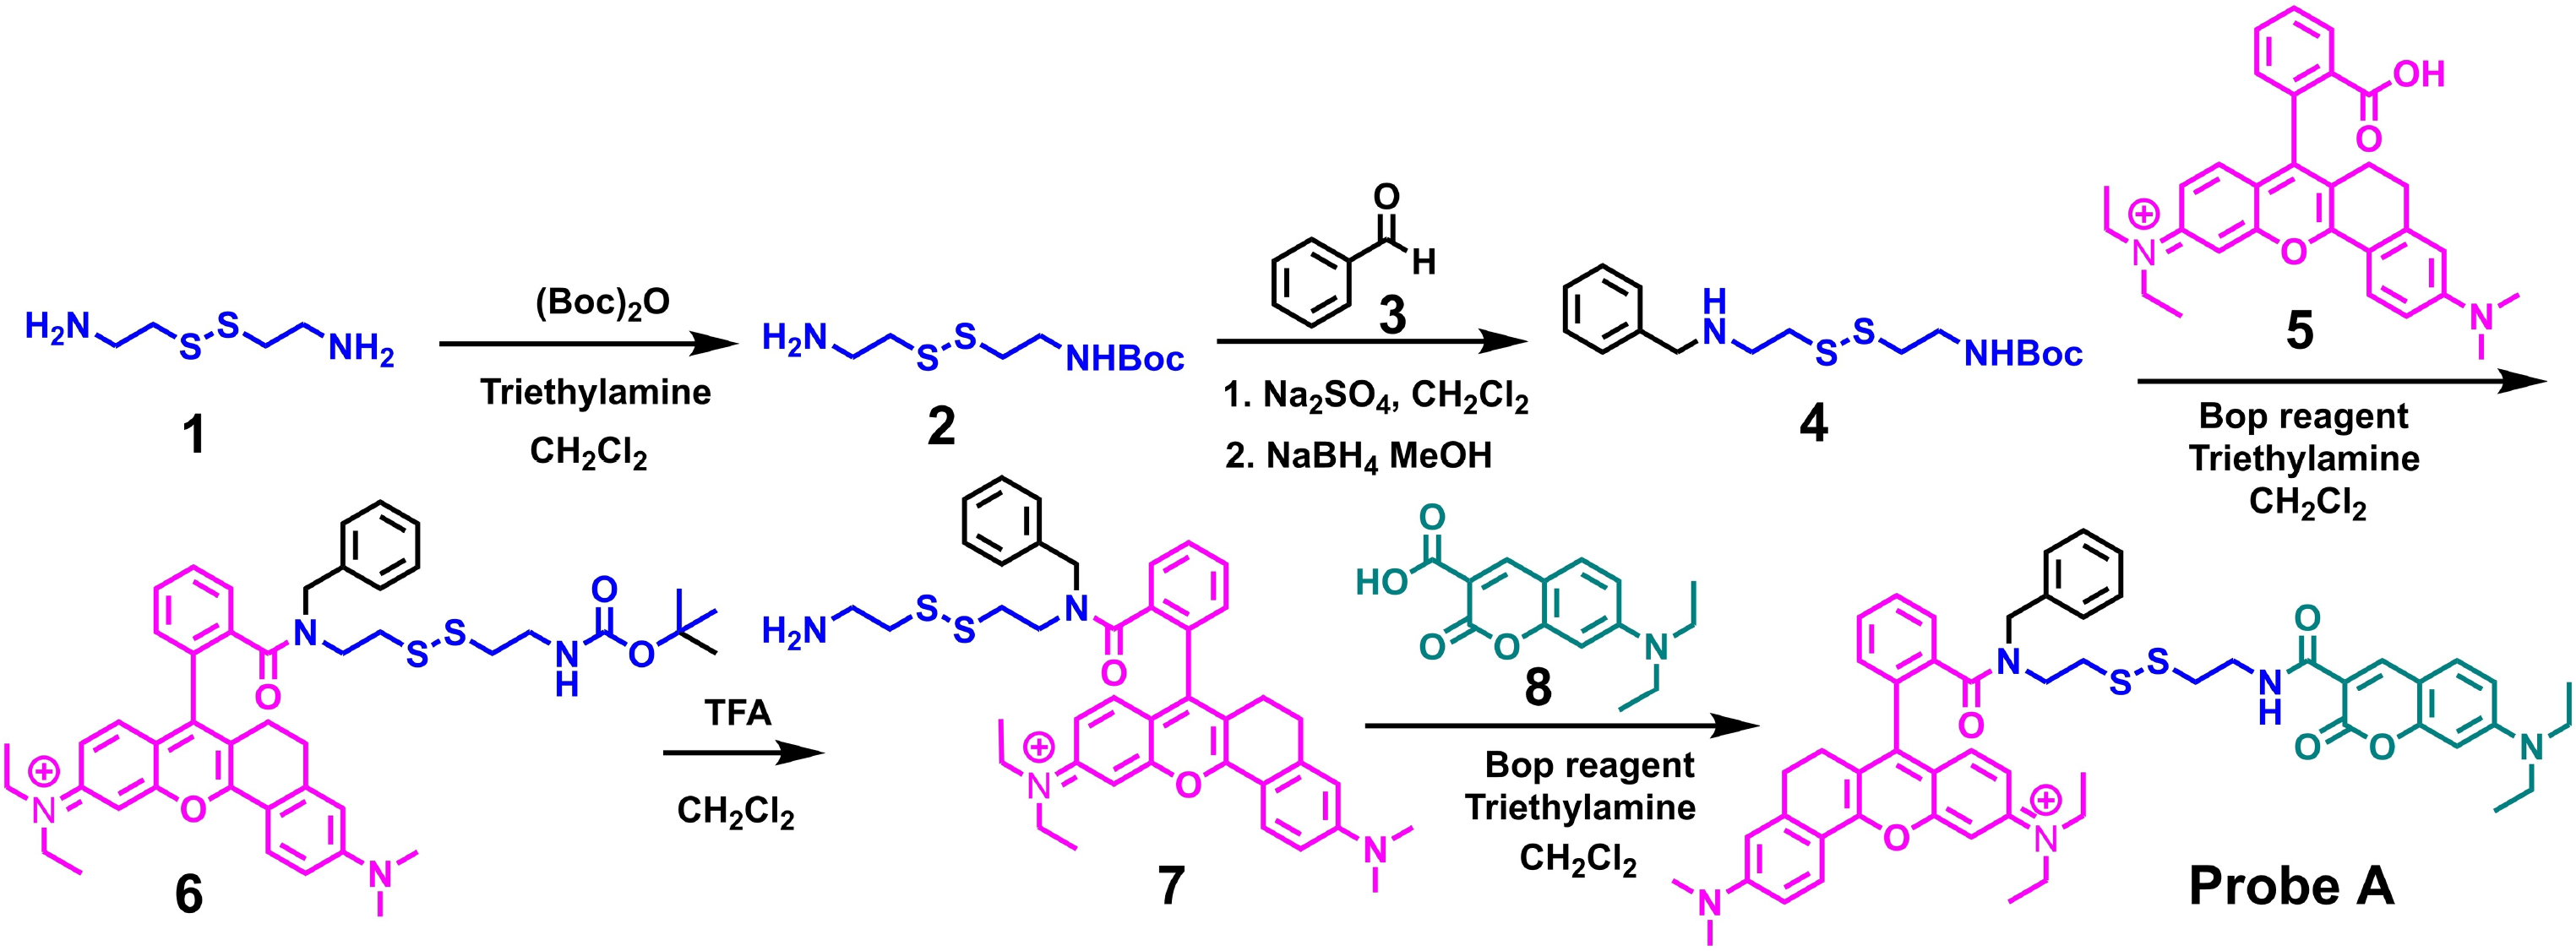
Synthetic approach to prepare a FRET-based ratiometric fluorescent probe A for GSH detection.
Optical responses of the probe to glutathione
We investigated whether the probe responds to glutathione ratiometrically and quickly. Under excitation at 405 nm, probe A shows two fluorescence peaks with strong emission from the rhodamine acceptor at 652 nm and weak emission from the coumarin donor at 470 nm in the absence of GSH, Figure 1. The addition of 20 equivalents of GSH to a pH 7.4 buffer containing 5 μM of probe A gradually decreases the coumarin donor fluorescence and increases the rhodamine acceptor fluorescence under coumarin donor excitation, Figure 1. This occurs because GSH effectively reduces the disulfide bond separating the donor from the acceptor, thus prohibiting FRET. The response time of the probe to GSH is 60 minutes as fluorescence signals of the donor and acceptor are unchanged after 60 minutes (Figure 1).
Figure 1.
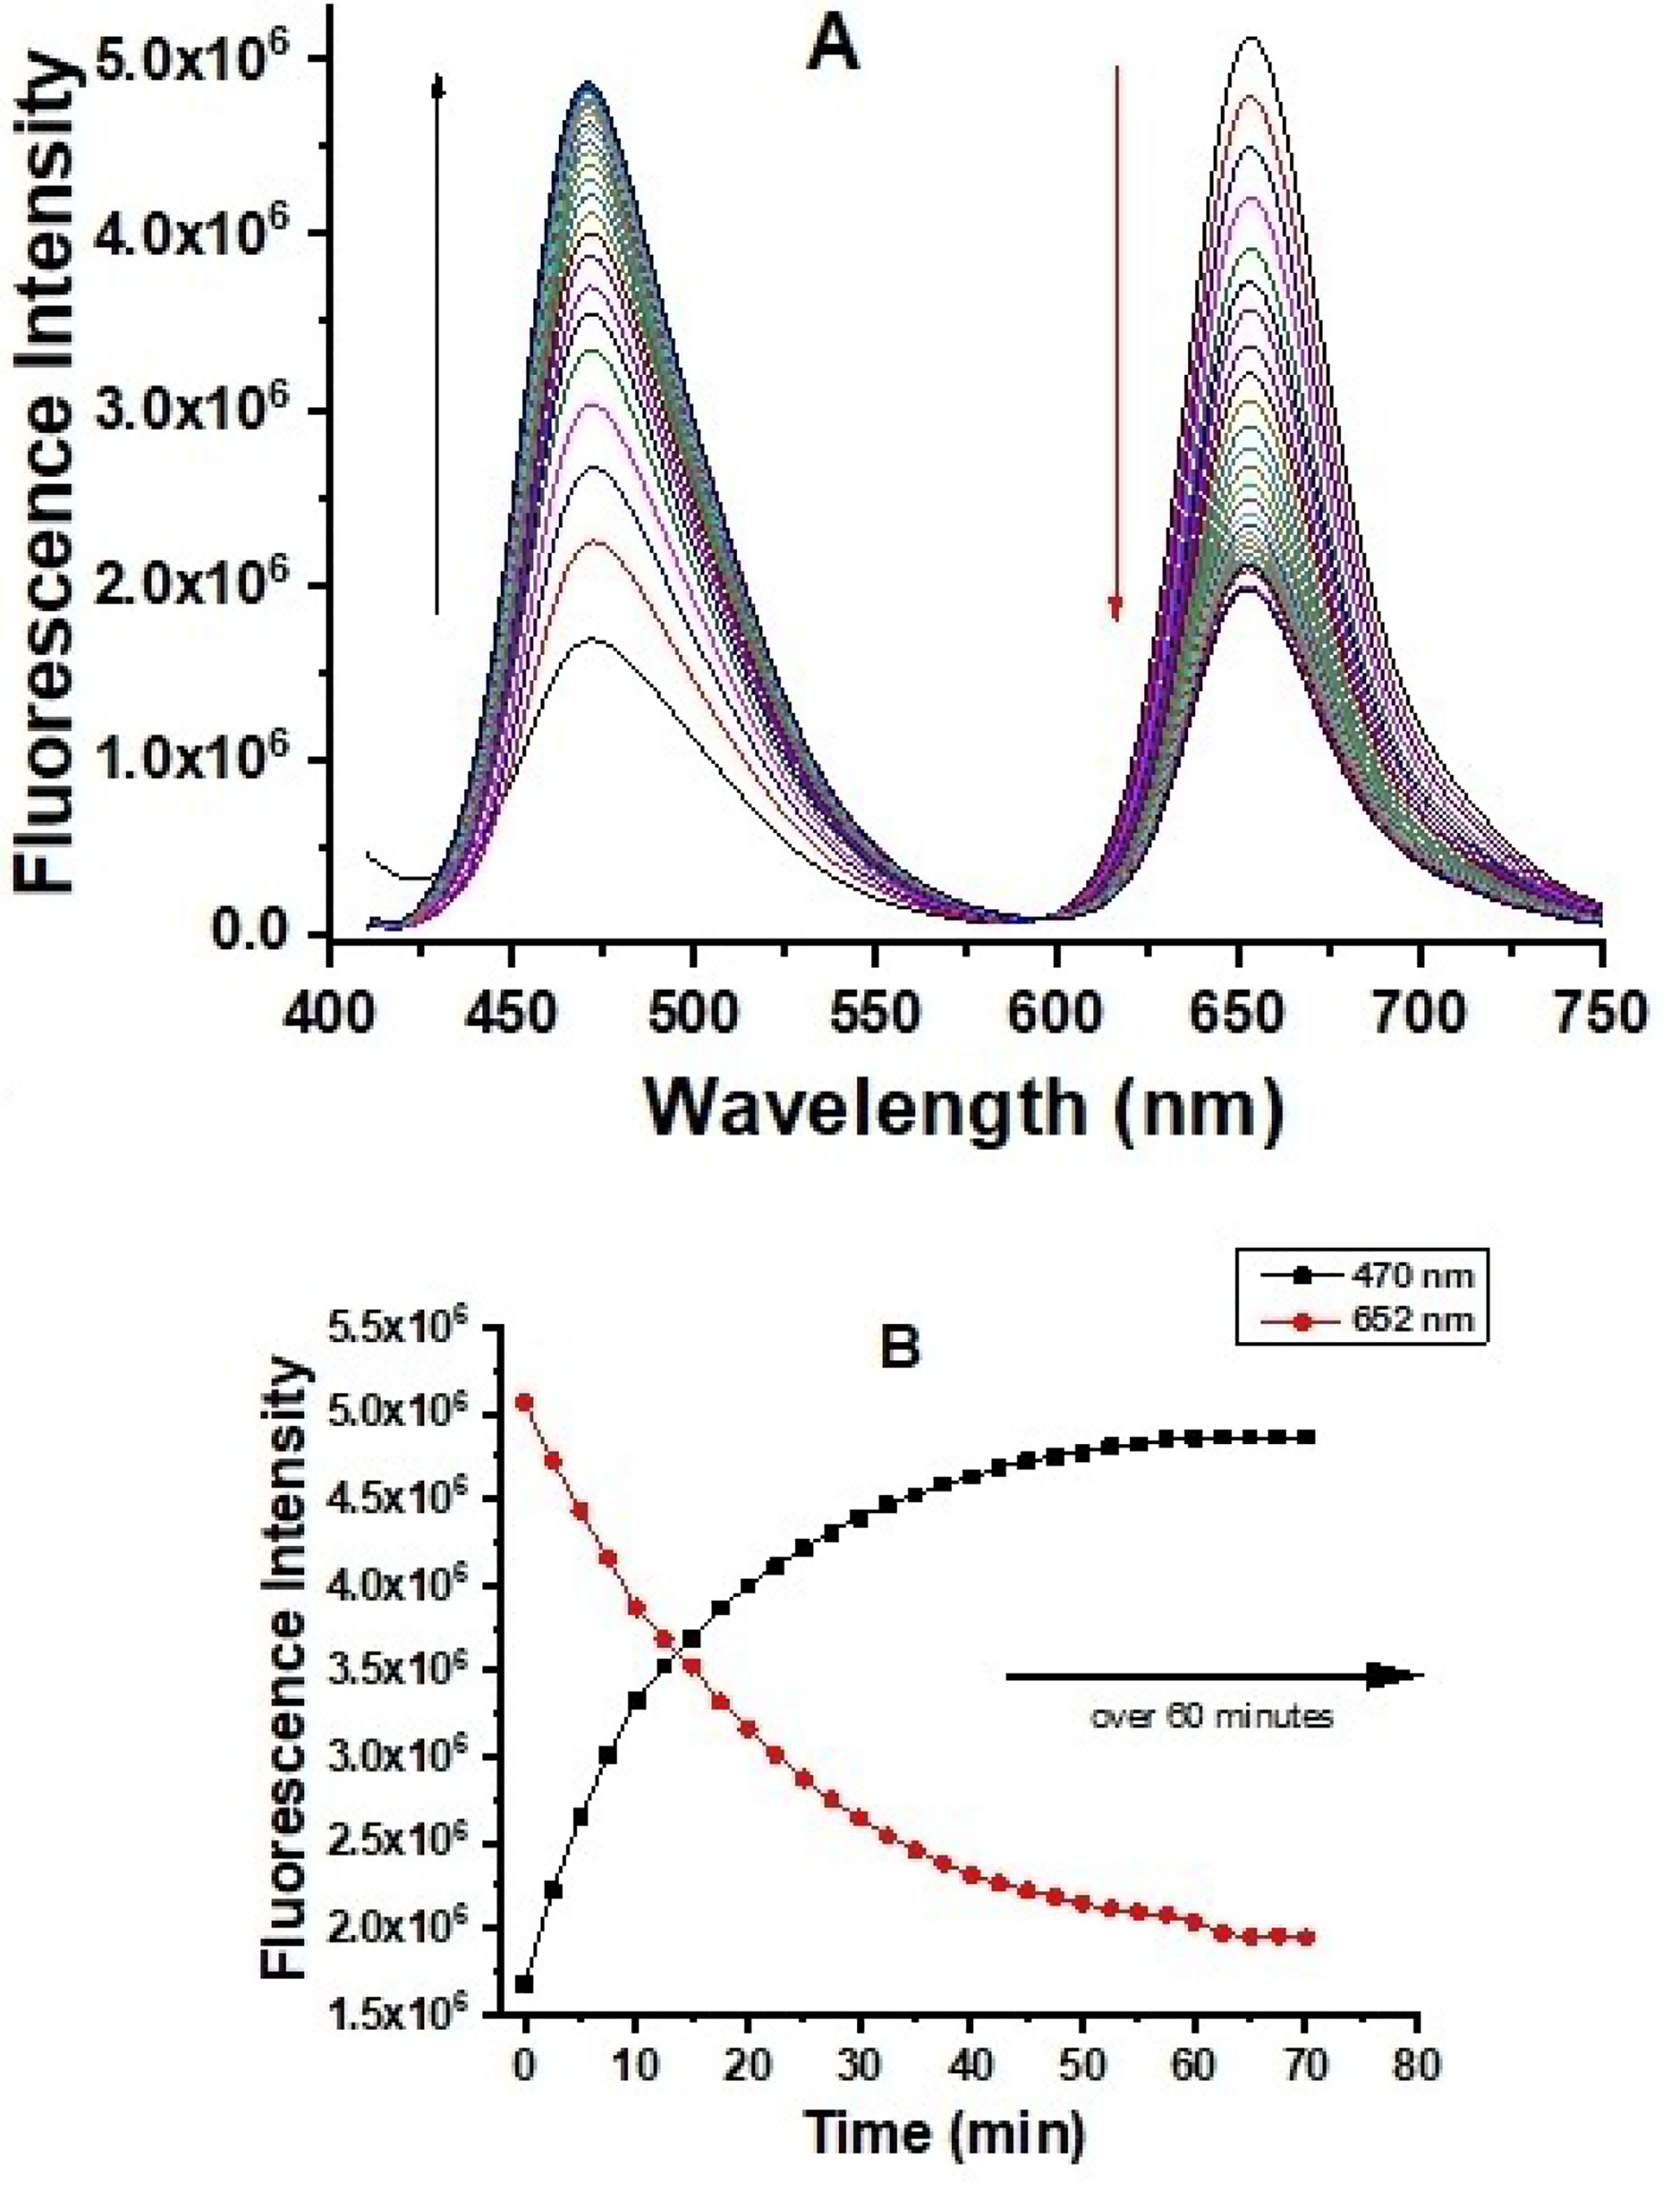
Fluorescence spectra (A) and ratiometric fluorescence responses (B) of 5 μM probe A to 20 equivalents of GSH in a 20 mM PBS buffer (pH 7.4) containing 30% ethanol over 60 min under coumarin excitation at 405 nm.
We also evaluated absorption responsive ranges of the probe to different GSH concentrations over 60 minutes. The probe displays two well-separated absorption peaks with a coumarin absorption peak at 430 nm and a rhodamine absorption peak at 625 nm in the absence of GSH. A gradual increase of the GSH concentration results in an increase of both the donor and acceptor absorption peaks, which results from the formation of two reaction products after GSH effectively ruptures the disulfide bond through a reduction reaction (Figure 2).
Figure 2.
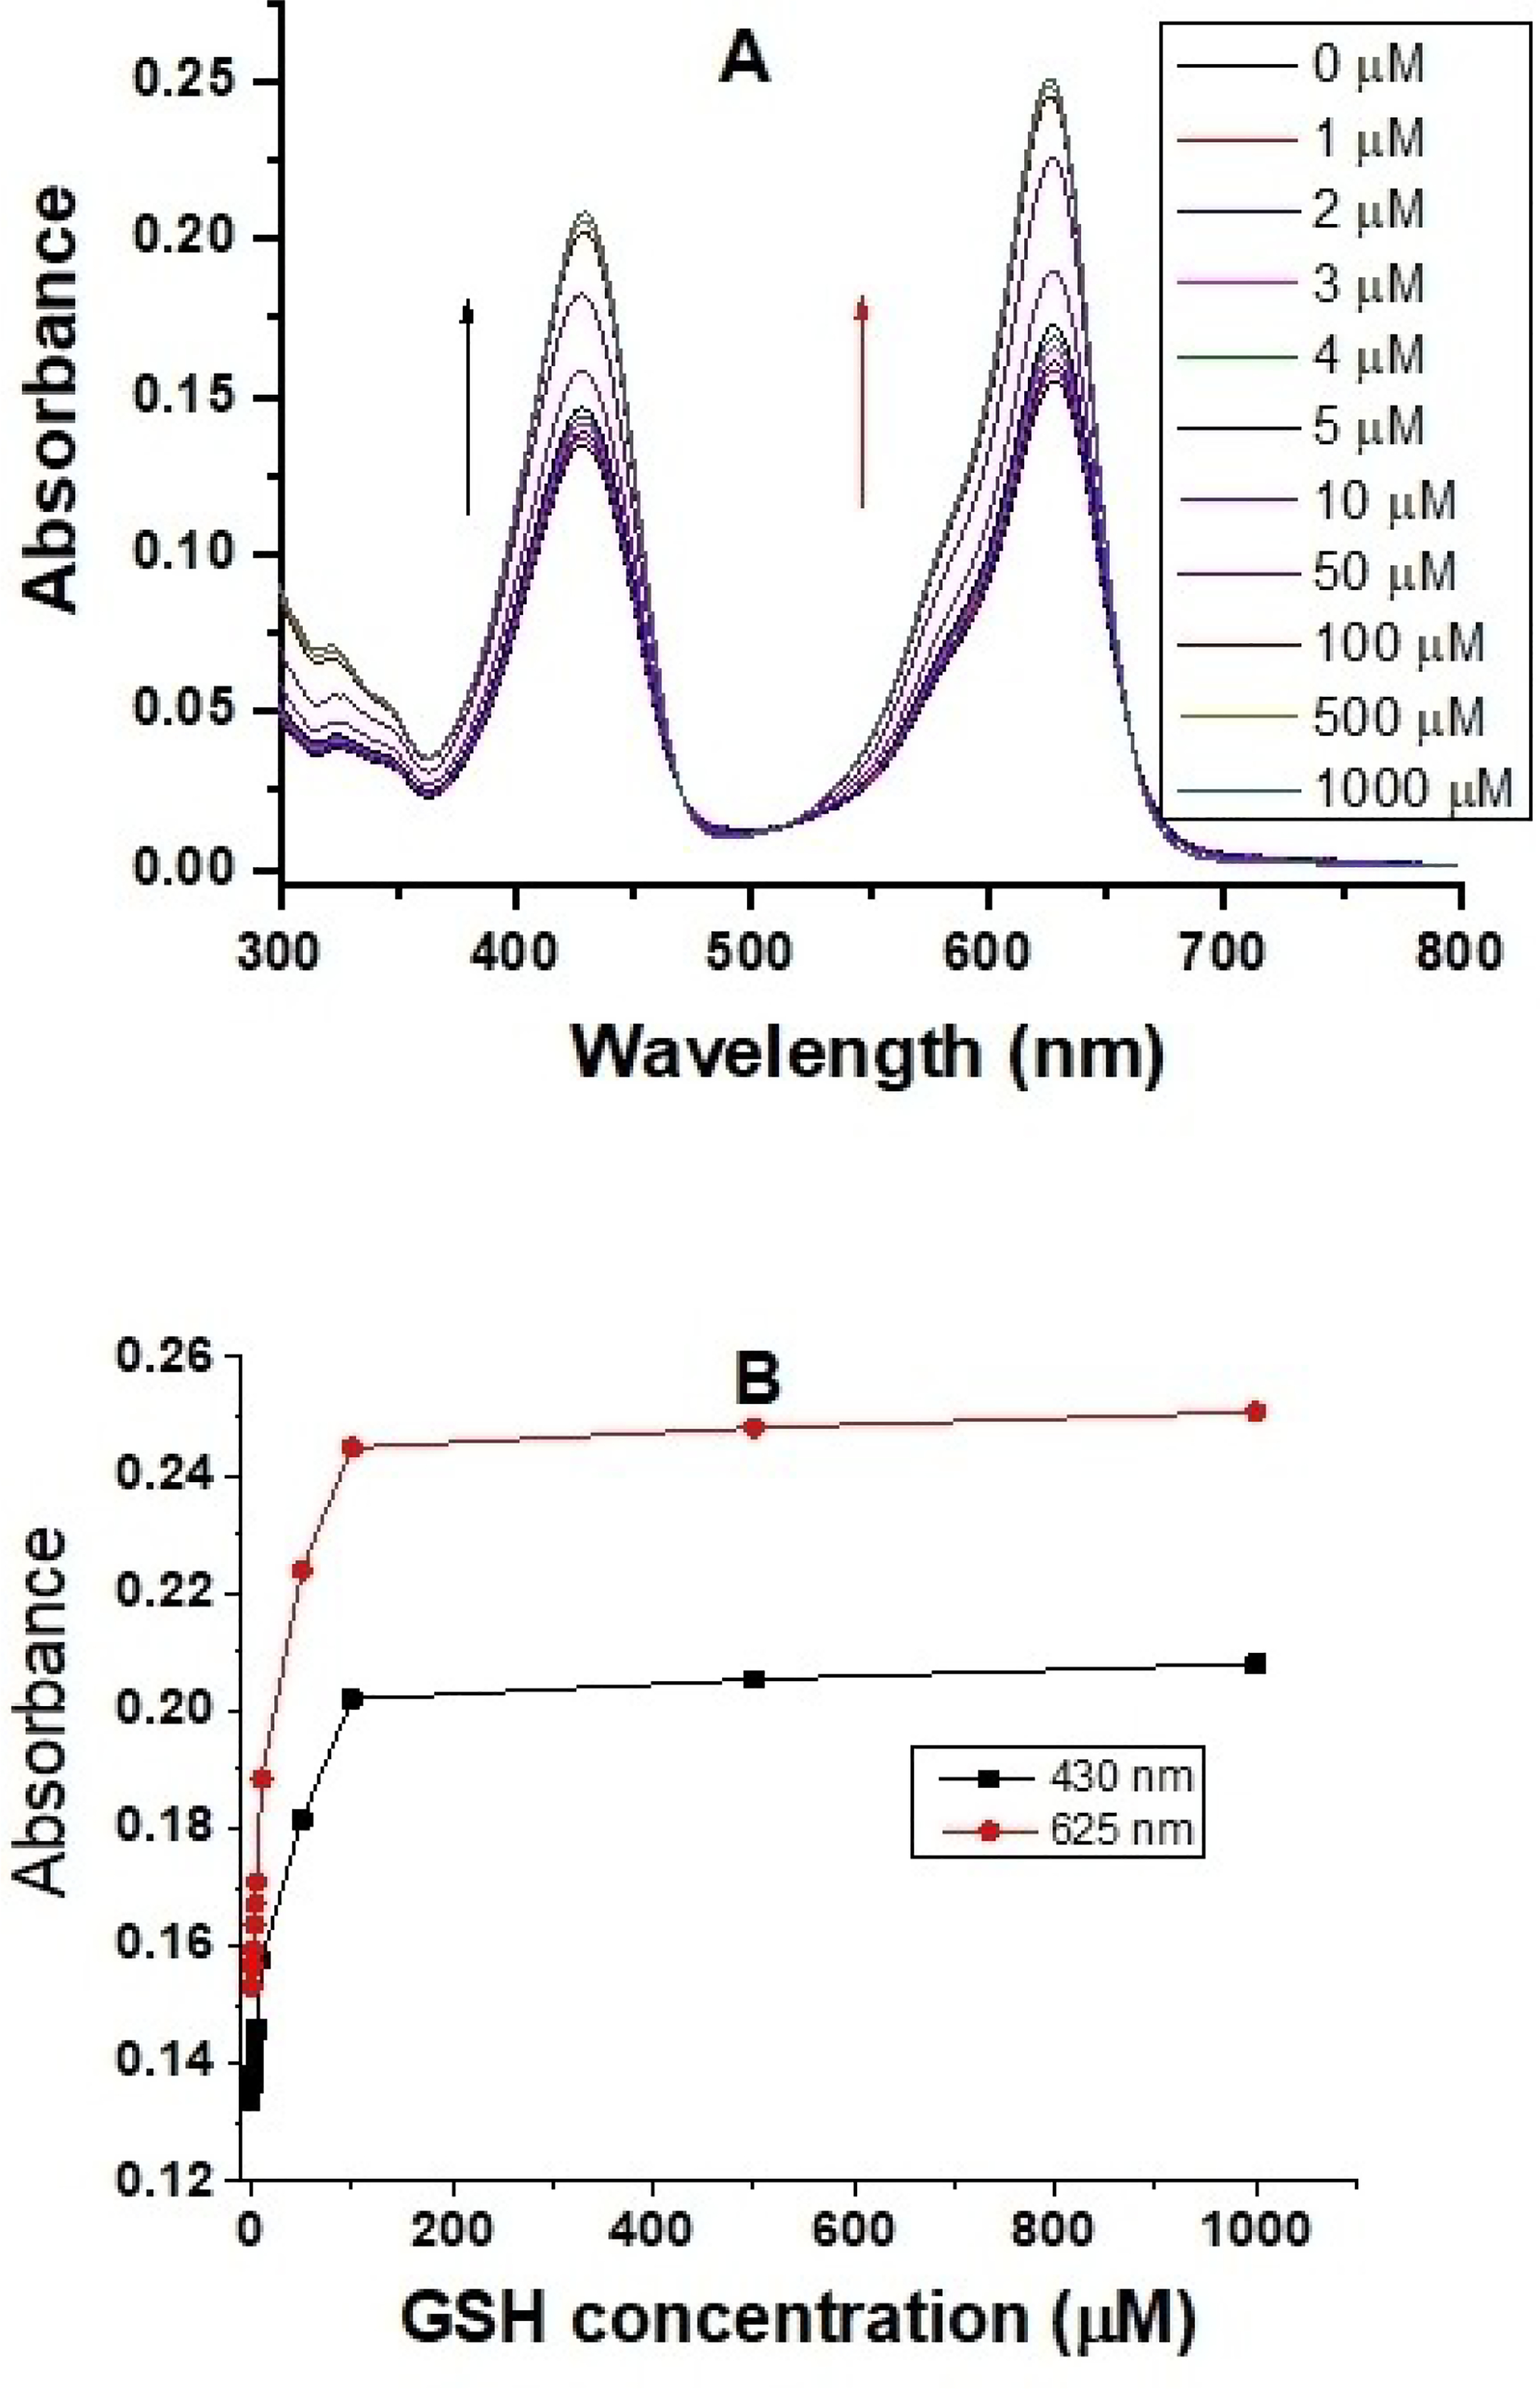
Absorption spectra (A) and absorbance responses (B) of 5 μM probe A to different GSH concentrations in a 20 mM PBS buffer (pH 7.4) containing 30% ethanol in 60 minutes.
As the GSH concentrations increased from 0 to 1000 μM, the molar absorptivity of the coumarin donor increased from 2.7×10⁴ L.mol−1.cm−1 to 3.1×10⁴ L.mol−1.cm−1 (Figure 3A), and that of the rhodamine acceptor increased from 4.2× 10⁴ L.mol−1.cm−1 to 5.0×10⁴ L.mol−1.cm−1 (Figure 3B).
Figure 3.
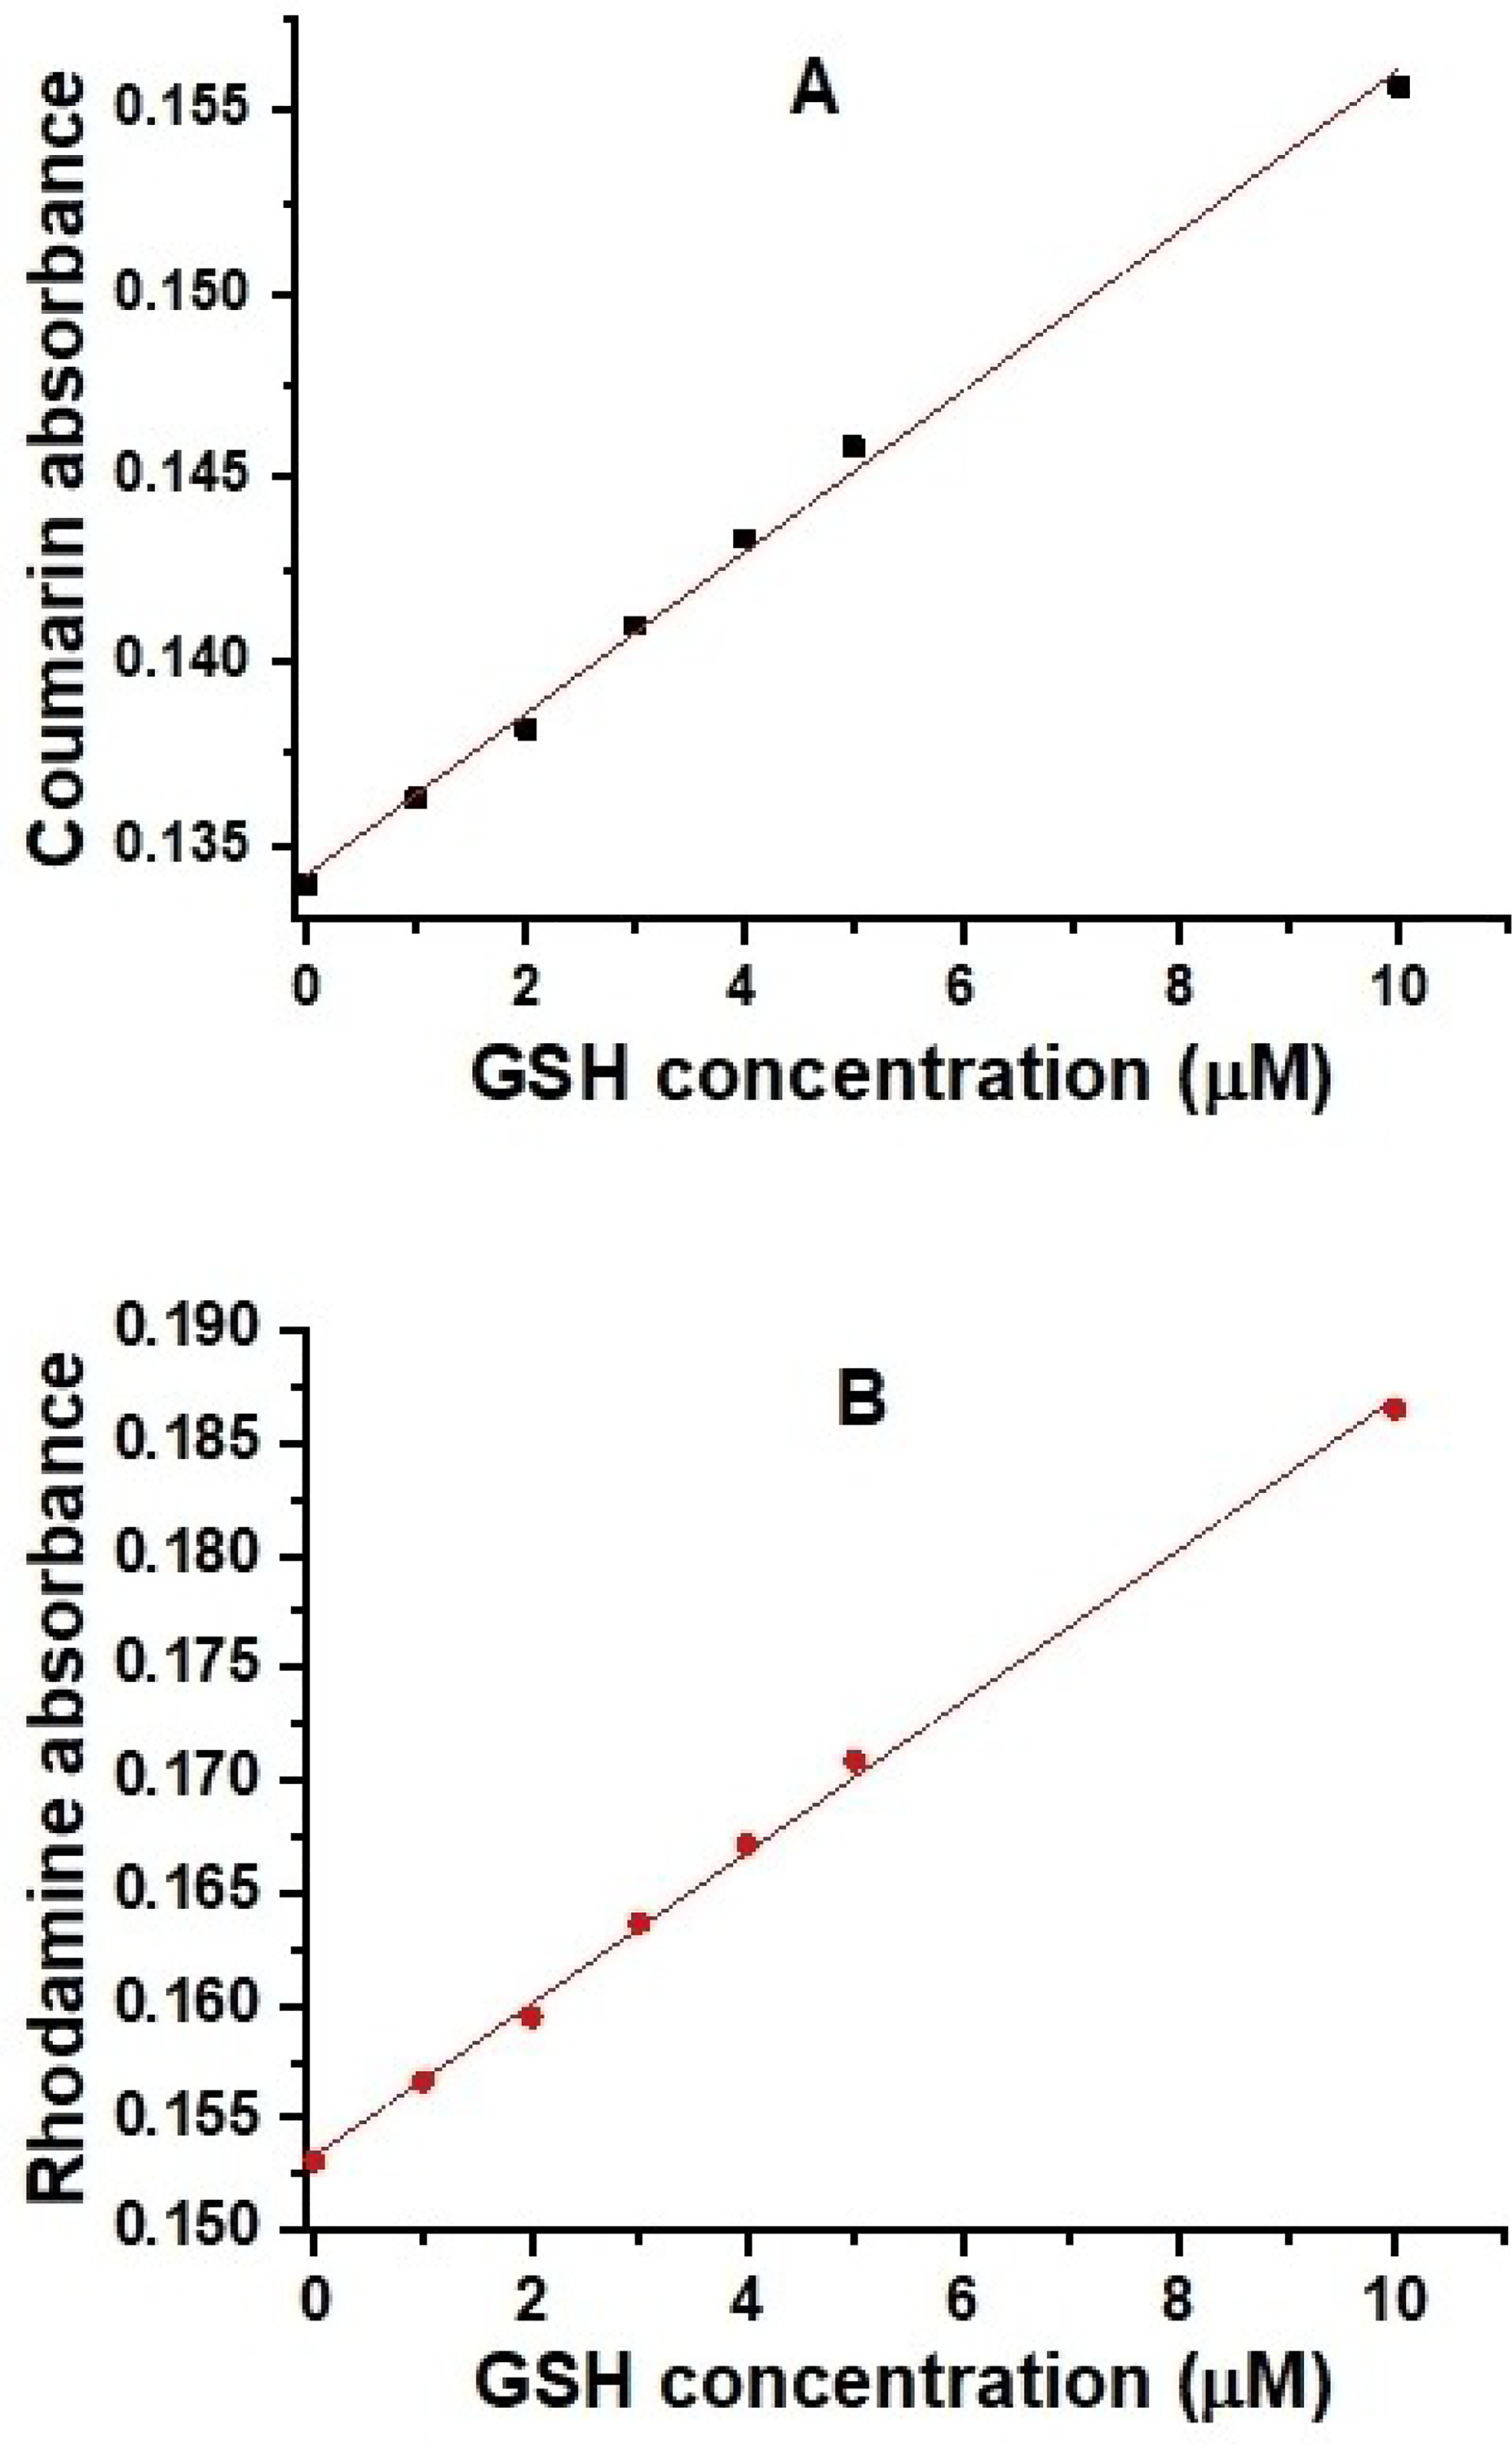
Linear responses of probe A coumarin (A) or rhodamine (B) absorbance to the GSH concentration.
We found that probe A shows a good linear response to GSH from 1.0 μM to 10 μM with a detection limit of 0.8 μM (Figure 3A). An increase in the extinction coefficients of both donor and acceptor fluorophores upon addition of GSH may arise from an increase in donor and acceptor solubility in ethanol-water mixed solutions.
We further investigated the fluorescence-responsive ranges of the probe to increases in GSH concentration. When the GSH concentration is gradually increased, the fluorescence of the rhodamine acceptor at 652 nm proportionally decreased and that of the coumarin donor increased at 470 nm under coumarin donor excitation at 405 nm. Responses of the probe to GSH arise from reductions in the quantity of FRET from the donor to the acceptor because GSH reduces the disulphide-tethered spacer between the donor and acceptor, resulting in their separation (Figure 4).
Figure 4.
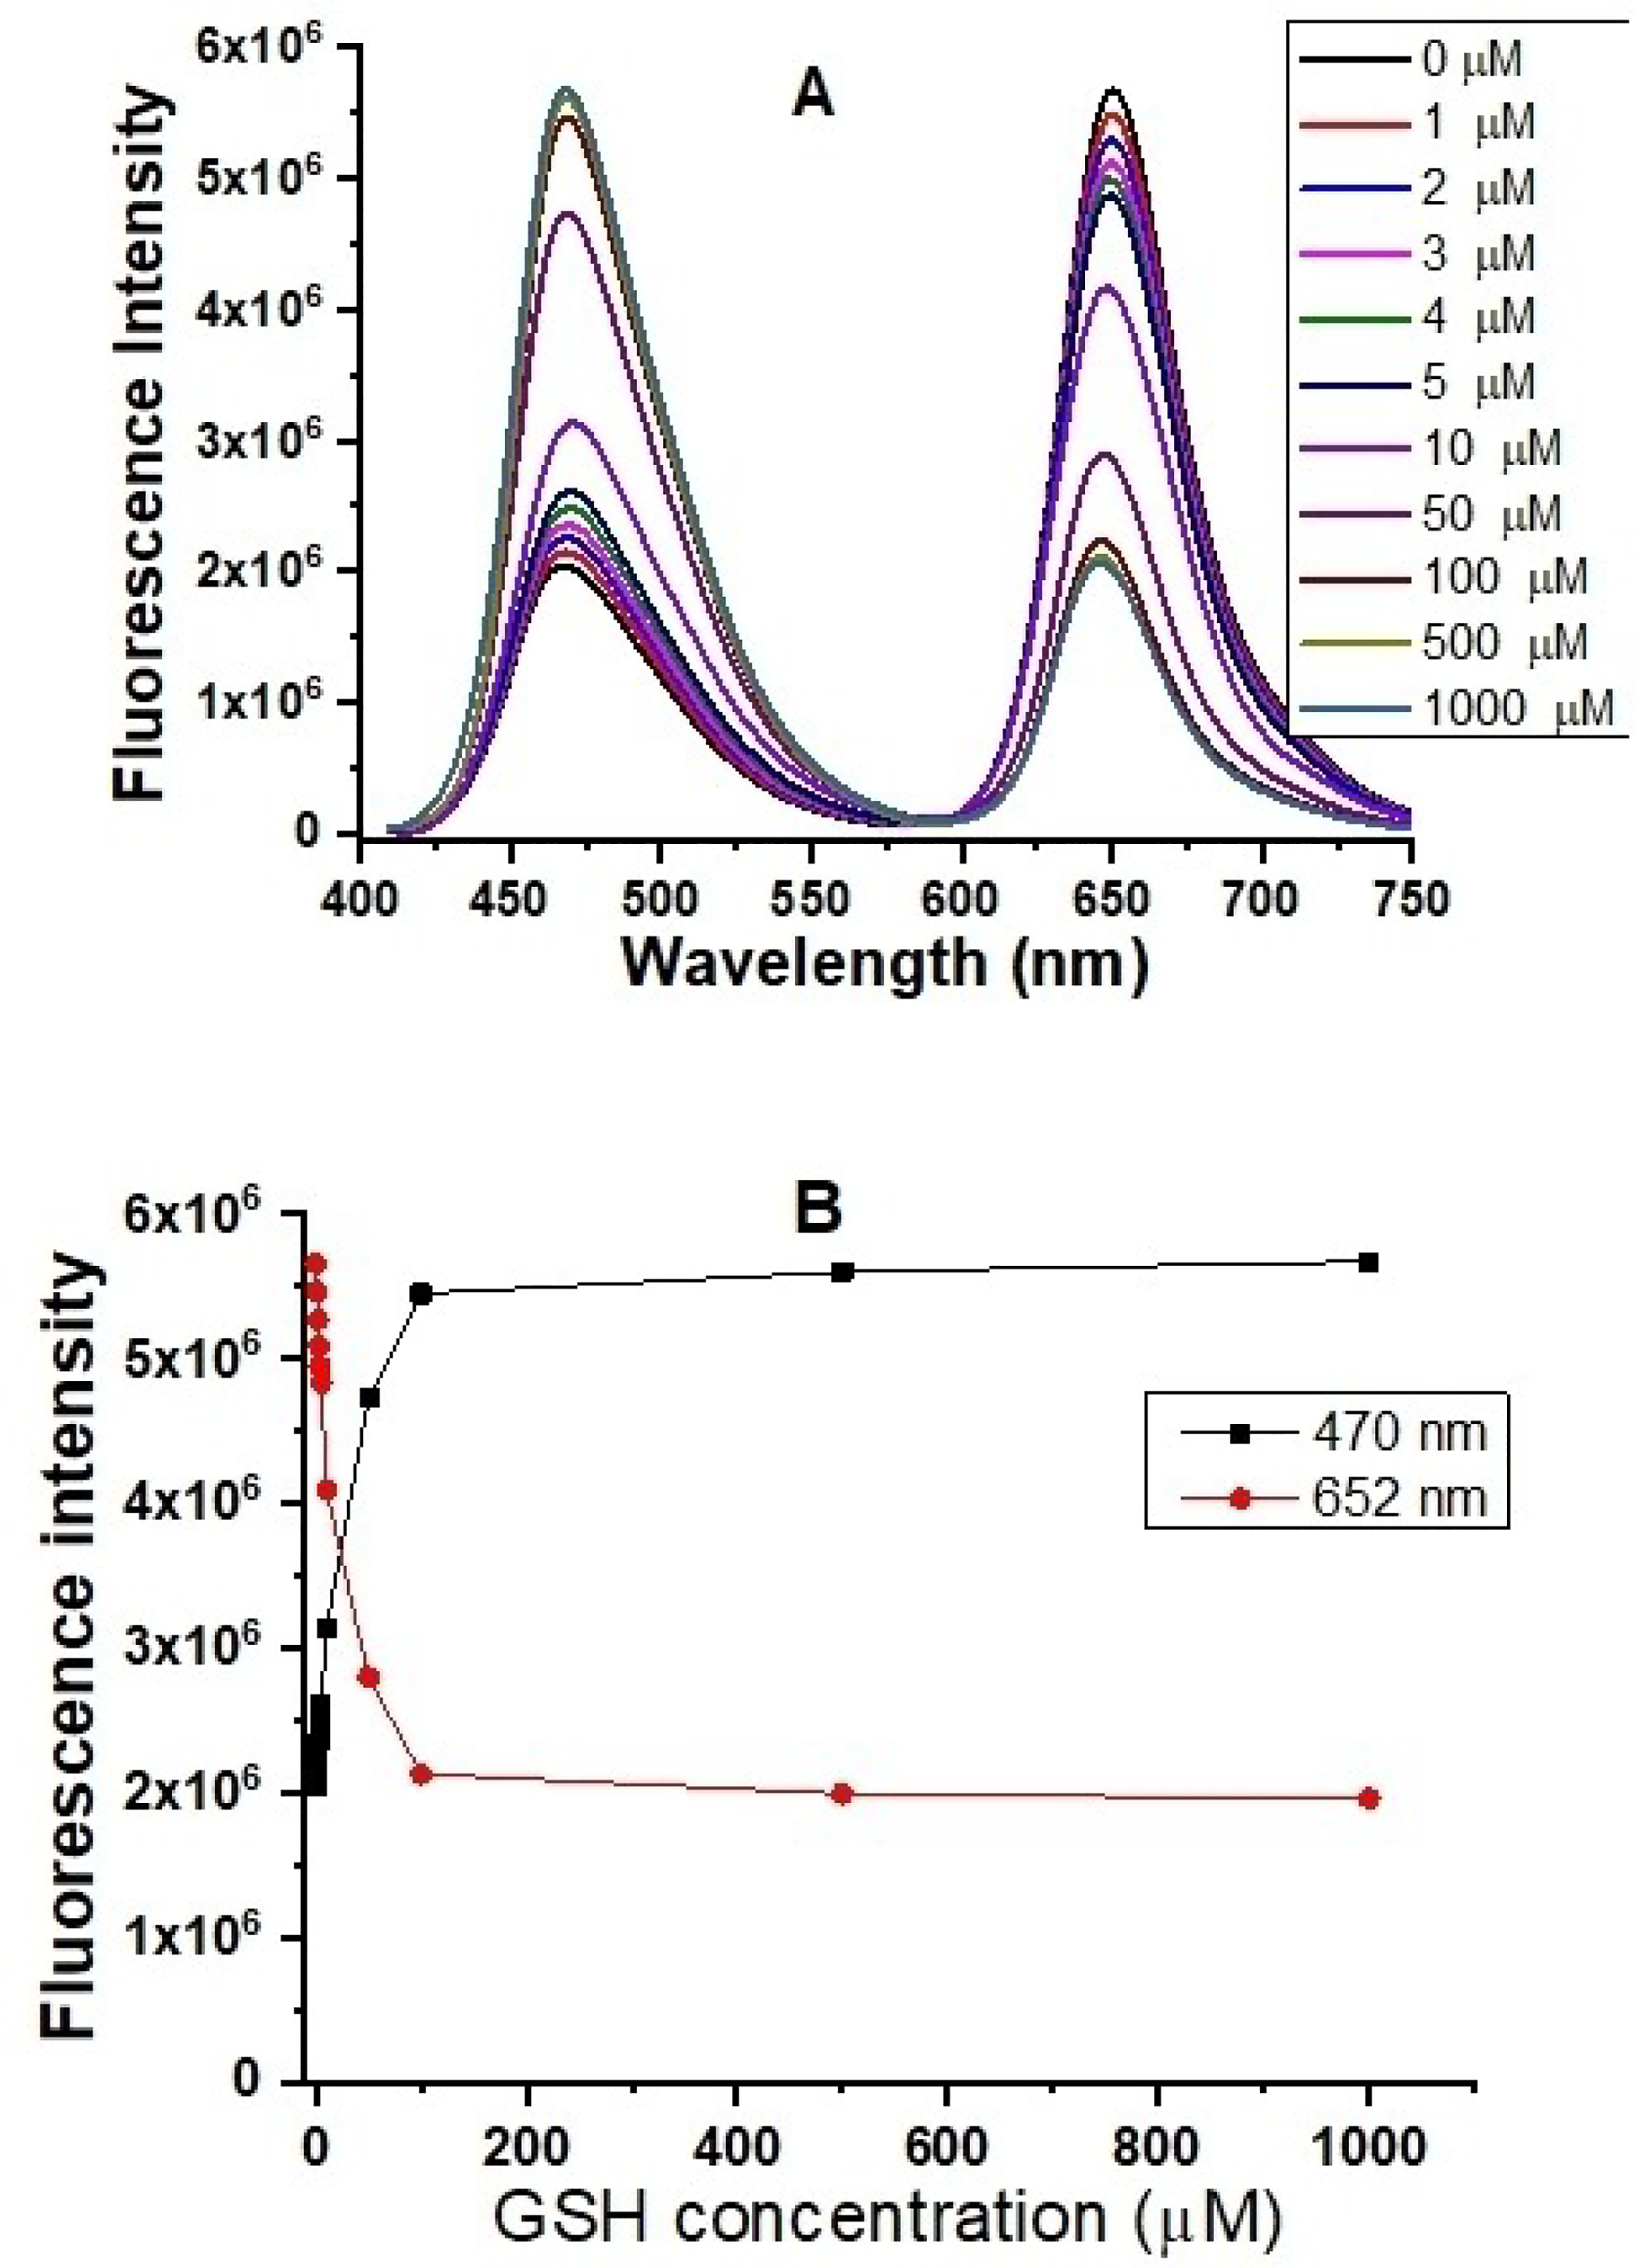
Fluorescence spectra (A) and fluorescence responses (B) of 5 μM probe A to different GSH concentrations in a 20 mM PBS buffer (pH 7.4) containing 30% ethanol in 60 minutes under excitation of 405 nm.
The quantum yield of the coumarin donor increased from 13.2% to 23.8% under coumarin excitation (i.e., at 405 nm). The fluorescence quantum yield of the rhodamine acceptor decreased from 20.5% to 7.0% under coumarin excitation at 405 nm when the concentration of GSH was increased from 0 to 1.0×10³ μM (Figure 4). The FRET efficiency from the coumarin donor to the rhodamine acceptor was calculated to be 82.3%.
The rhodamine fluorescence increased under rhodamine excitation at 550 nm upon a gradual increase of the GSH concentration, which is consistent with an absorbance increase of the rhodamine acceptor with a GSH concentration increase (Figures 2 and 5). The fluorescence increase of the rhodamine acceptor upon addition of GSH may result from the enhanced solubility of the new reaction products that prevent self-quenching of rhodamine acceptor as the rhodamine acceptor is less hydrophobic after the probe reacts with GSH.
Figure 5.
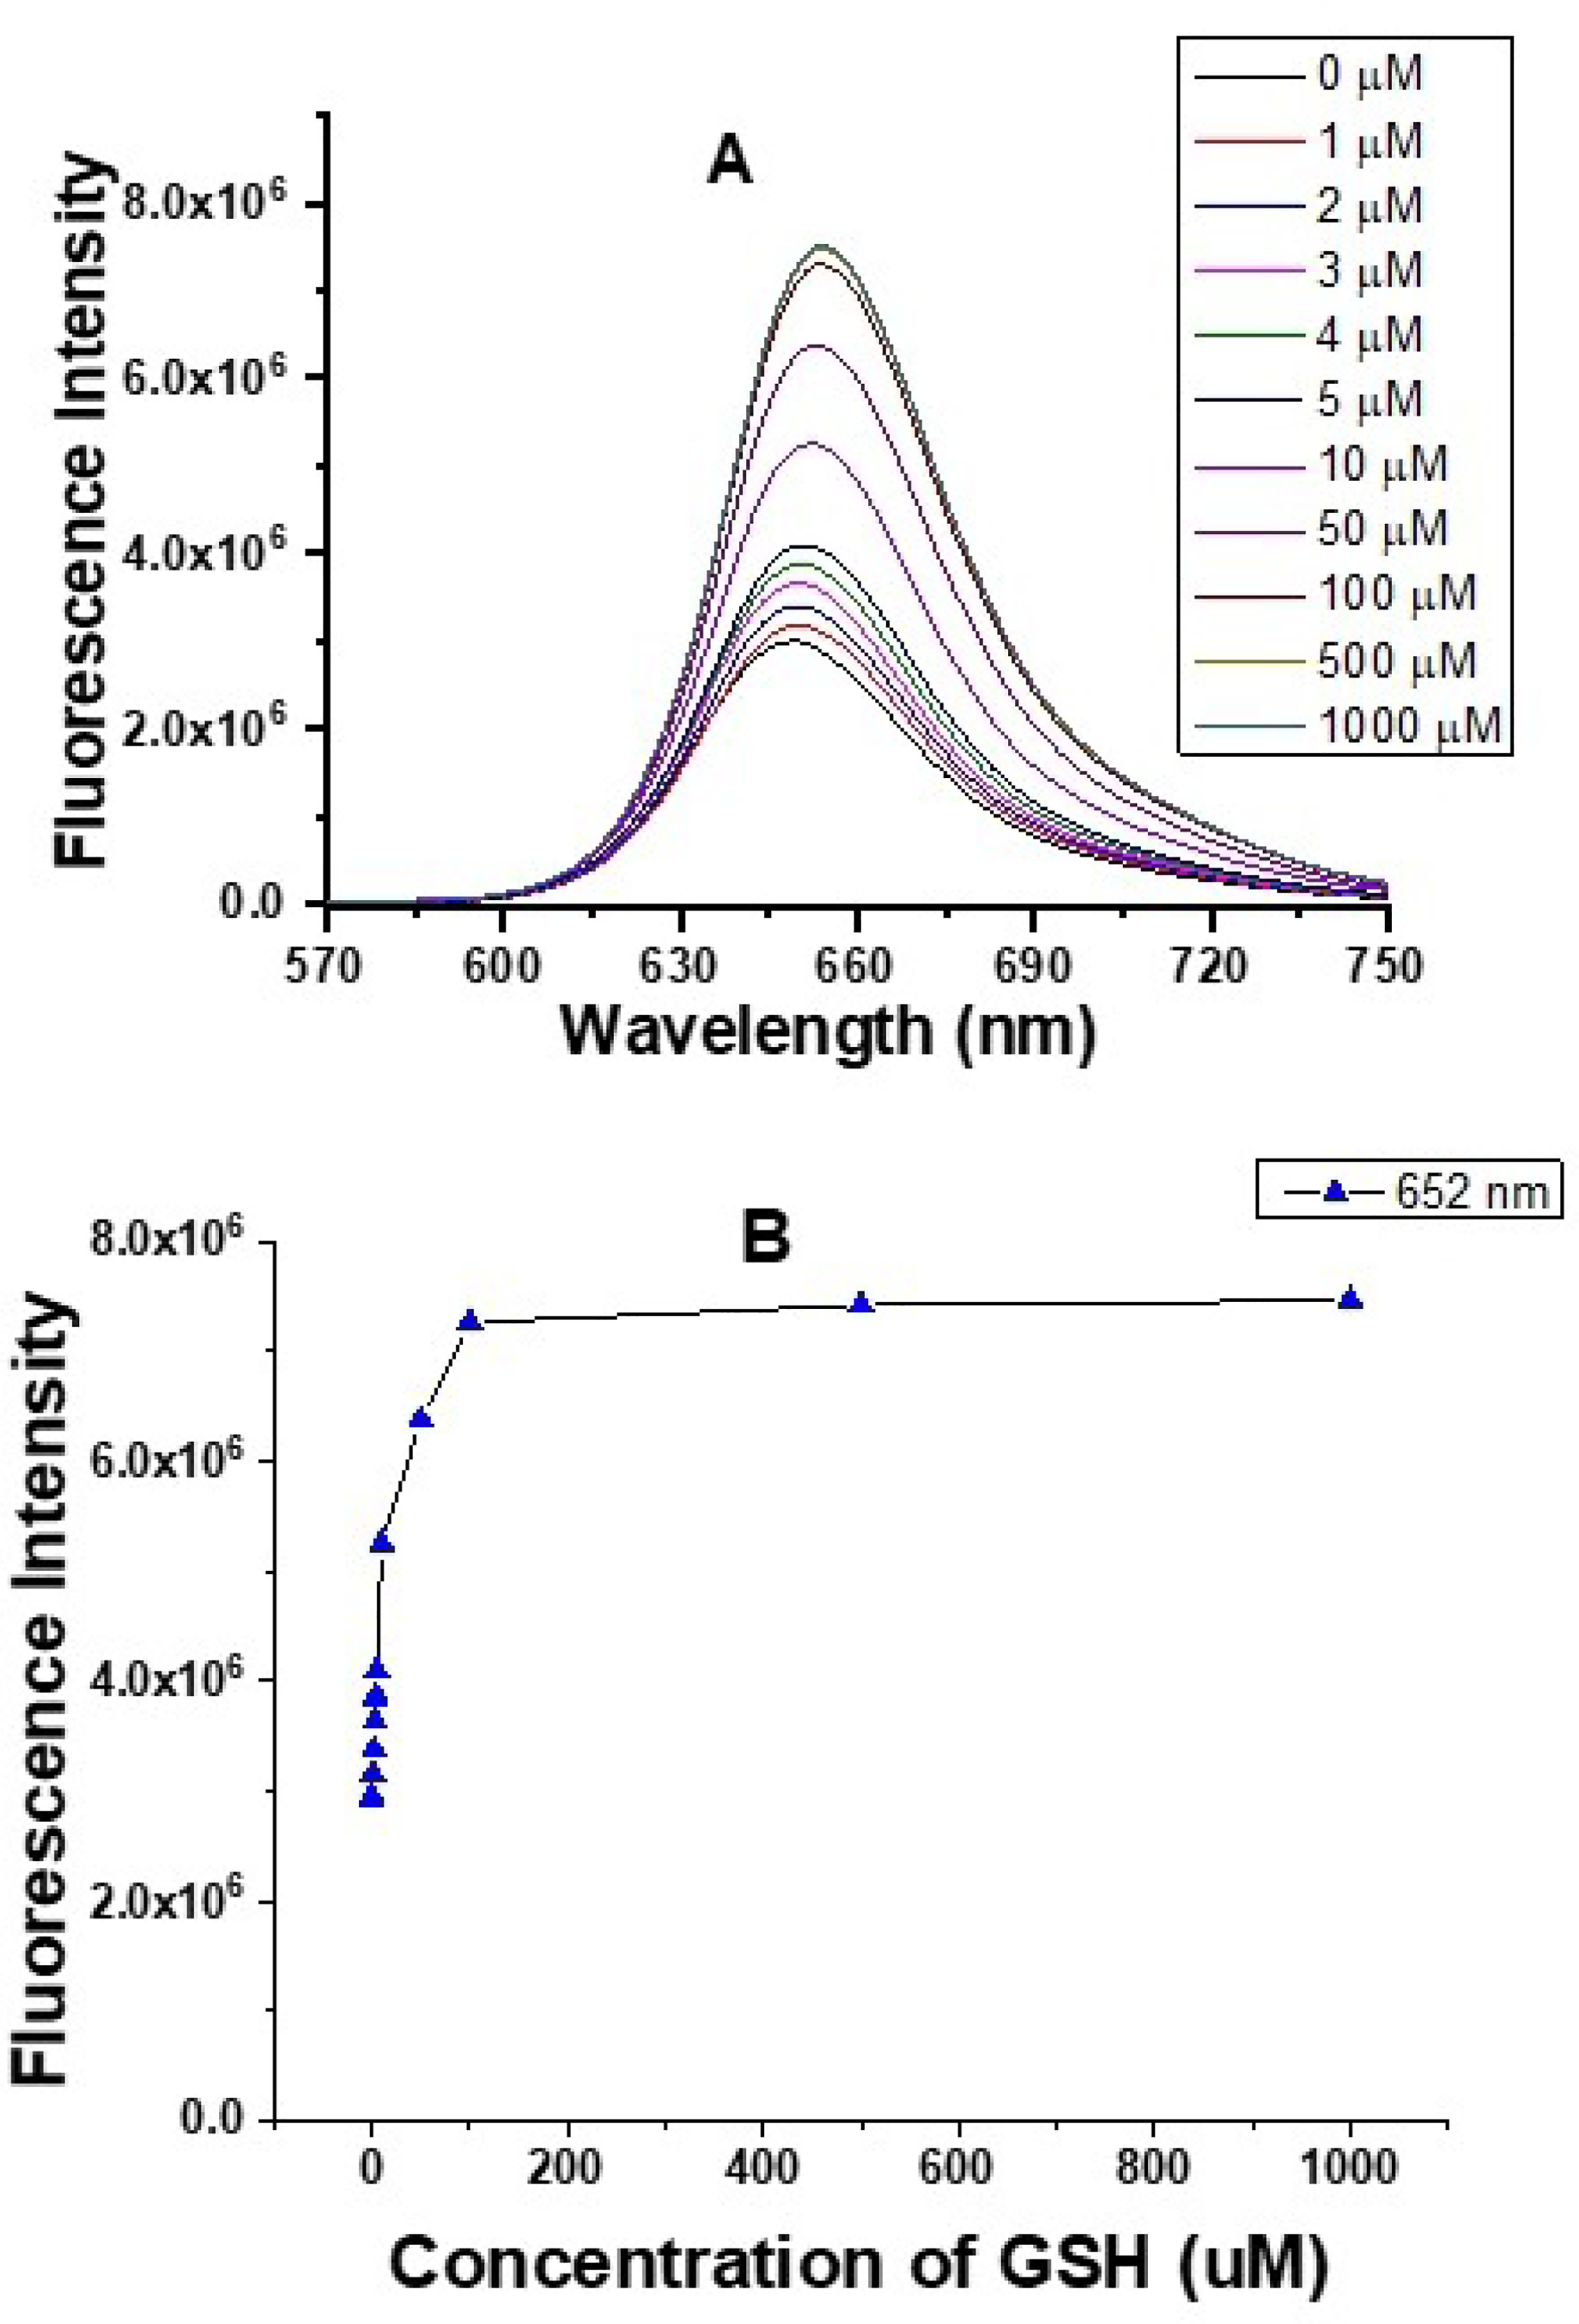
Fluorescence spectra (A) and fluorescence responses (B) of 5 μM probe A to different GSH concentrations in a 20 mM PBS buffer (pH 7.4) containing 30% ethanol in 60 minutes under excitation of 550 nm.
Theoretical results
It was necessary to conduct theoretical calculations to understand the isolated nature of the electronic transitions described above and the nature of the increases in absorption or fluorescence upon rupture of the S–S linkage. As depicted in Figure 6, two transitions are calculated. Excited State 1, see Table S2, judging from the localization of the color, is restricted to the rhodamine moiety and occurs at 538 nm, which is in good agreement with the experimental value of 625 nm. The only other noted transition, (based on considerations of oscillator strength, f) i.e., Excited State 6, is completely localized on the coumarin moiety and was assessed at 377 nm, which is also in good agreement with the experimental value of 430 nm. There is no electronic communication between these two parts of the molecule and, as mentioned previously, the increase in the absorptive or fluorescent intensity is ascribable to the increase in the molar absorptivity of the individual components produced upon rupture and reduction of the S–S linkage. This allows for the accurate determination of the GSH concentration within the ranges indicated in Figure 3. We also calculated the electronic transitions for the two sections of probe A, which would be obtained upon cleavage of the S–S bond. The data are provided as Supporting information labeled as B, see Table S4 and C, see Table S6. We also observed an increase in the oscillator strength of the transitions in the separated moieties, as compared to probe A as was noted experimentally. The oscillator strength is proportional to molar absorptivity.[27] For example, in B, the transition occurs at 532 nm with an oscillator strength (i.e., f) of 0.9011, as opposed to 0.8280 for probe A. Additionally in C, the transition occurs at 374 nm with f=0.7191, which is larger than the 0.6879 calculated for probe A.
Figure 6.
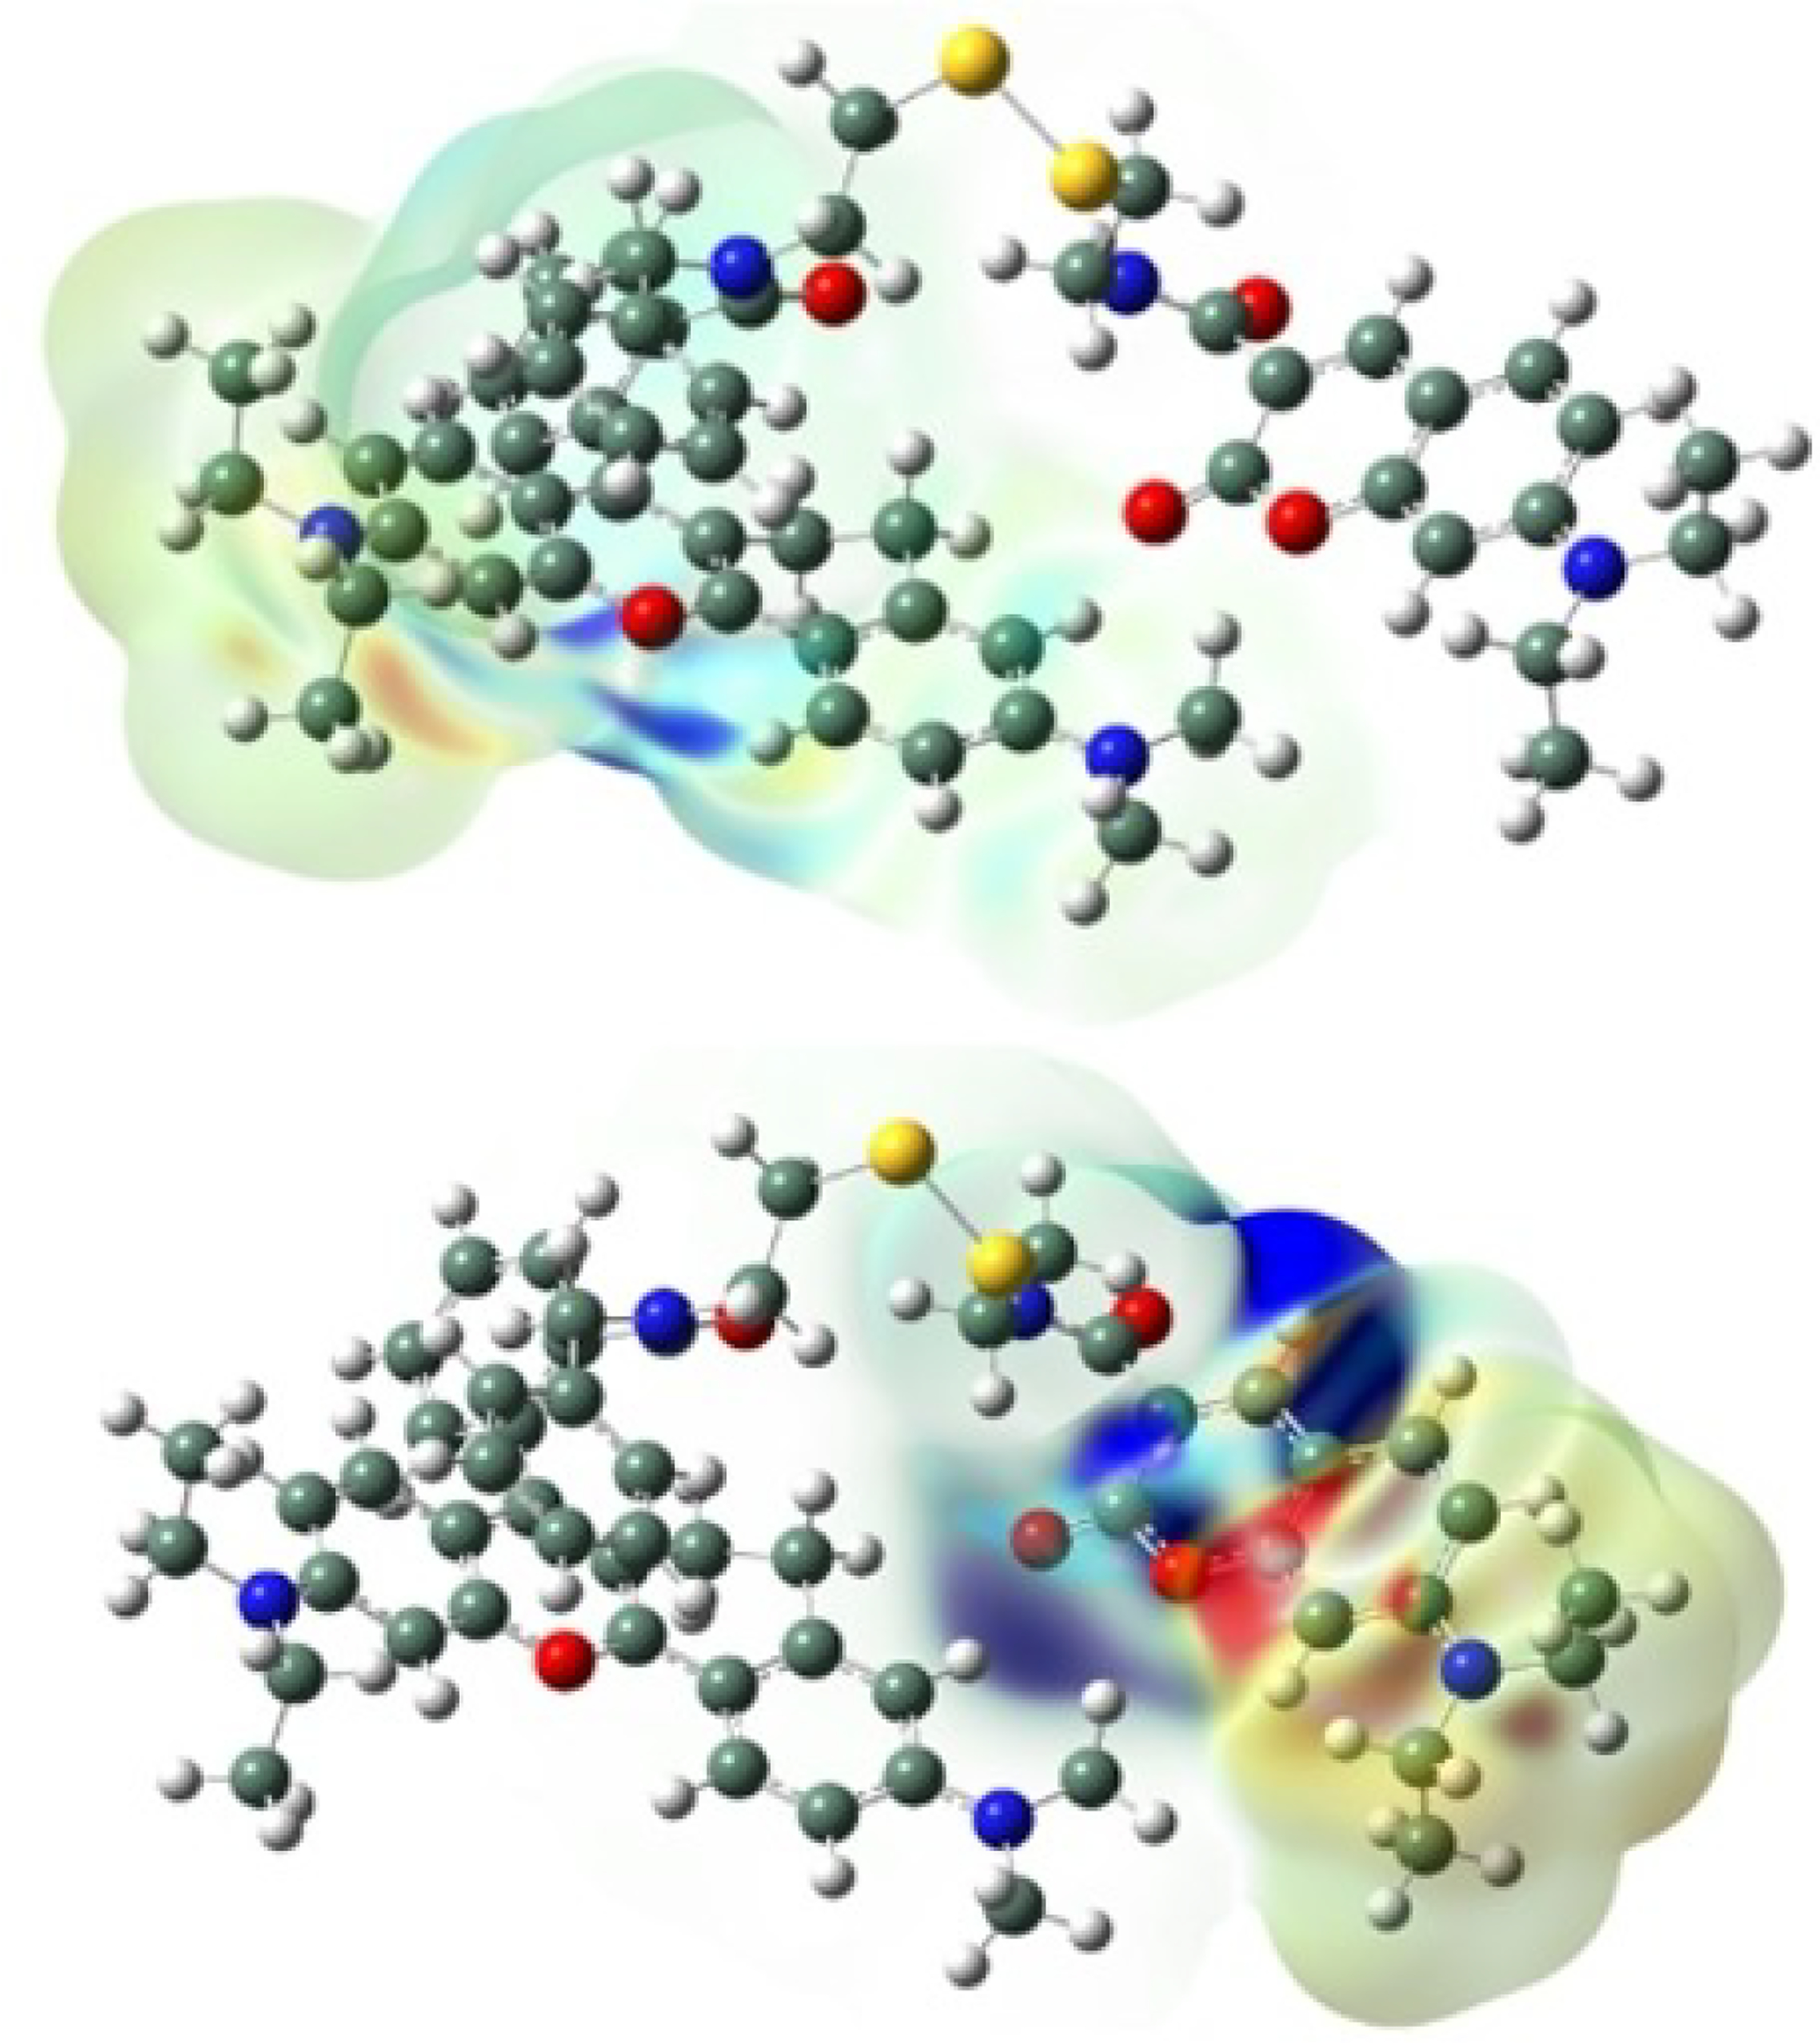
Current density illustrations for probe A with the figure on the left representing transitions assigned Excited State 1 at 538 nm, see Table S2 and, right, that due to Excited State 6 at 376 nm. Red and blue areas indicate ranges for the different densities of±7.822e−4 (left) and 1.612e−4 (right), see chart on top of the illustration.
The effect of the pH on the probe fluorescence responses to GSH
The probe shows very stable fluorescence from pH 5.0 to 8.0 in the absence of GSH. Decreases in the pH below 5.0 or increases above 8.0 result in fluorescence emission decreases. Similar effects on the probe fluorescence in the presence of GSH in that pH range were also observed (Figure 7). These results suggest that the probe can be utilized for fluorescence responses to GSH within physiological pH ranges from 5.0 to 8.0.
Figure 7.
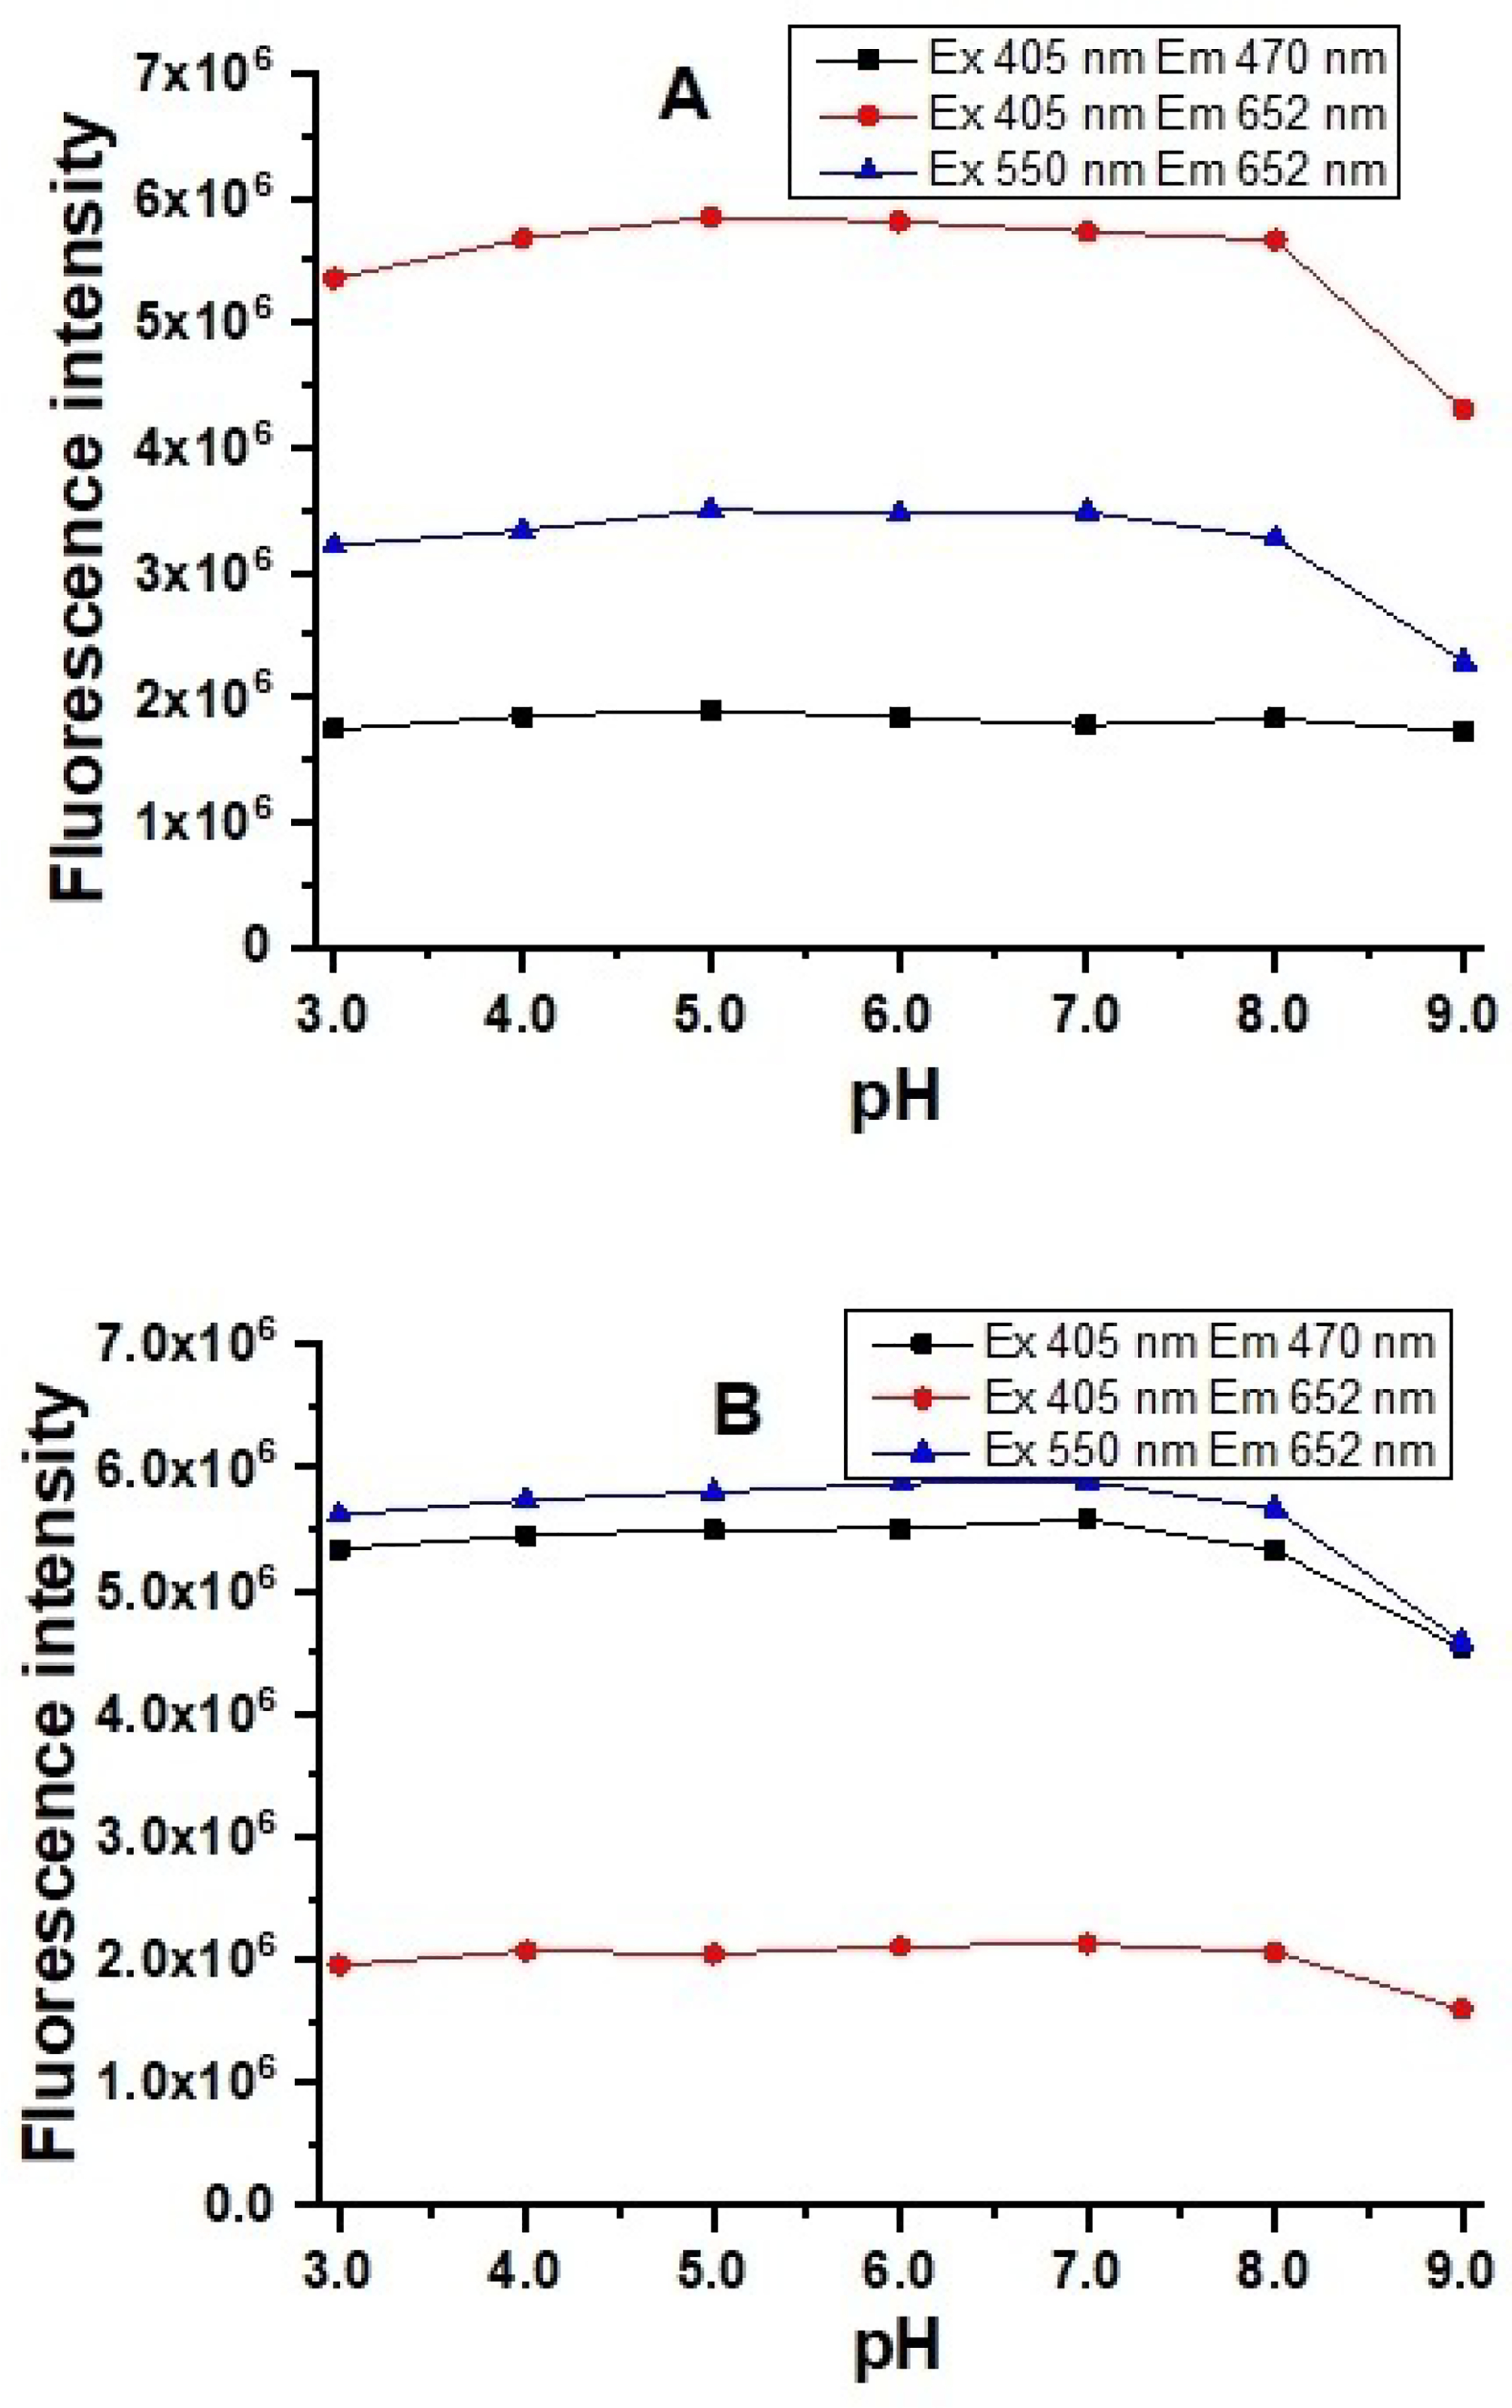
Fluorescence intensity of 5.0 μM of probe A in the absence (A) and presence (B) of 20 equivalents of GSH in 20 mM PBS buffers with different pH values containing 30% ethanol.
Probe selectivity to GSH over amino acids
The presence of 20 equivalents of amino acids, such as homocysteine, threonine, valine, isoleucine, tyrosine, proline, serine, leucine, glutamine, tryptophan, and methionine did not result in significant fluorescence changes, indicating that probe A exerts excellent selective responses to GSH over these amino acids, except cysteine (Figure 8). Cysteine can also reduce the disulfide bond to prevent donor-to-acceptor FRET, although with lower efficiency, as exemplified by the weaker fluorescence response compared to that obtained with GSH (Figure 8).
Figure 8.
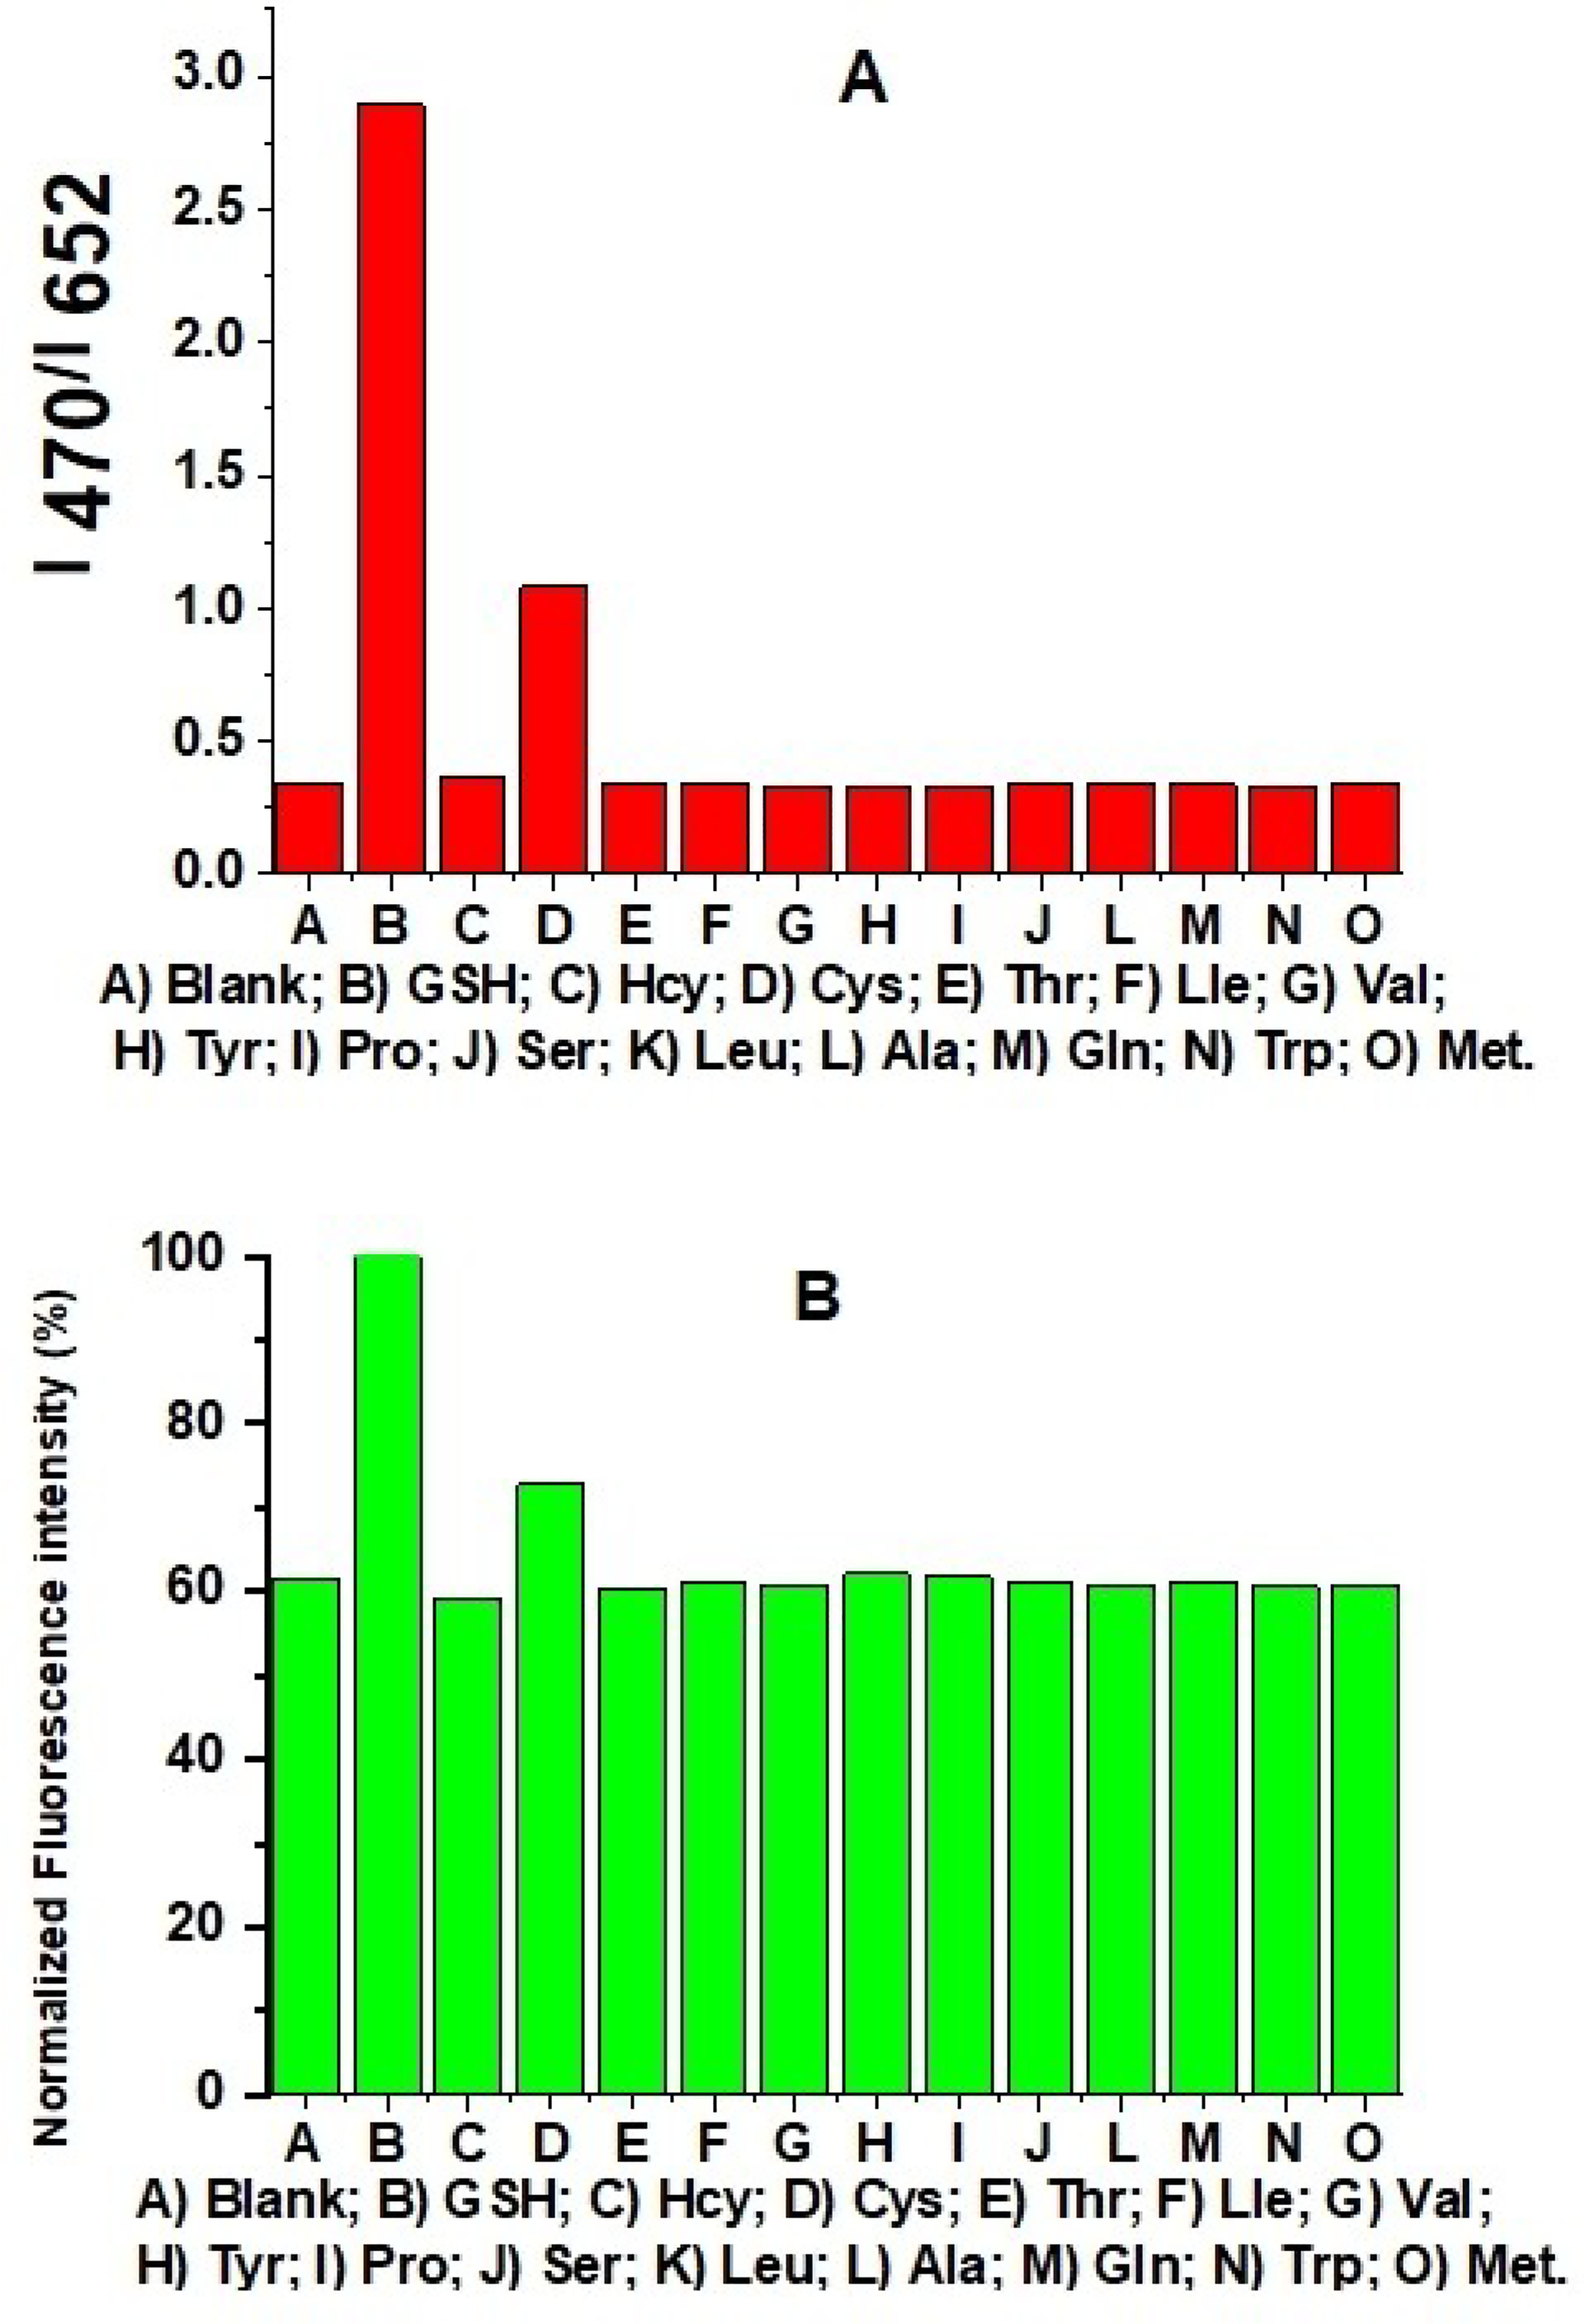
Probe A fluorescence intensity ratio of coumarin donor to rhodamine acceptor (A) and normalized rhodamine fluorescence intensity (B) under rhodamine excitation at 550 nm in 20 mM PBS buffer (pH 7.4) containing 30% ethanol, 5 μM probe A, 20 equivalents of GSH and different amino acids with 60-min incubation time.
The mechanism of probe A reaction with GSH
To explore the mechanism of probe A reacting with GSH, we used dithiothreitol (DTT), a common reagent for the cleavage of disulfide bonds. We let both DDT and GSH react with probe A and analyzed the products through high-resolution mass spectroscopy. As shown in Figures 9 and S30, both reactions resulted in a peak at 616.299 m/z, which arises from the fragmentation of the rhodamine acceptor, indicating that GSH and DDT possess the same ability to cleave the disulfide bond of probe A (Figure S30).
Figure 9.
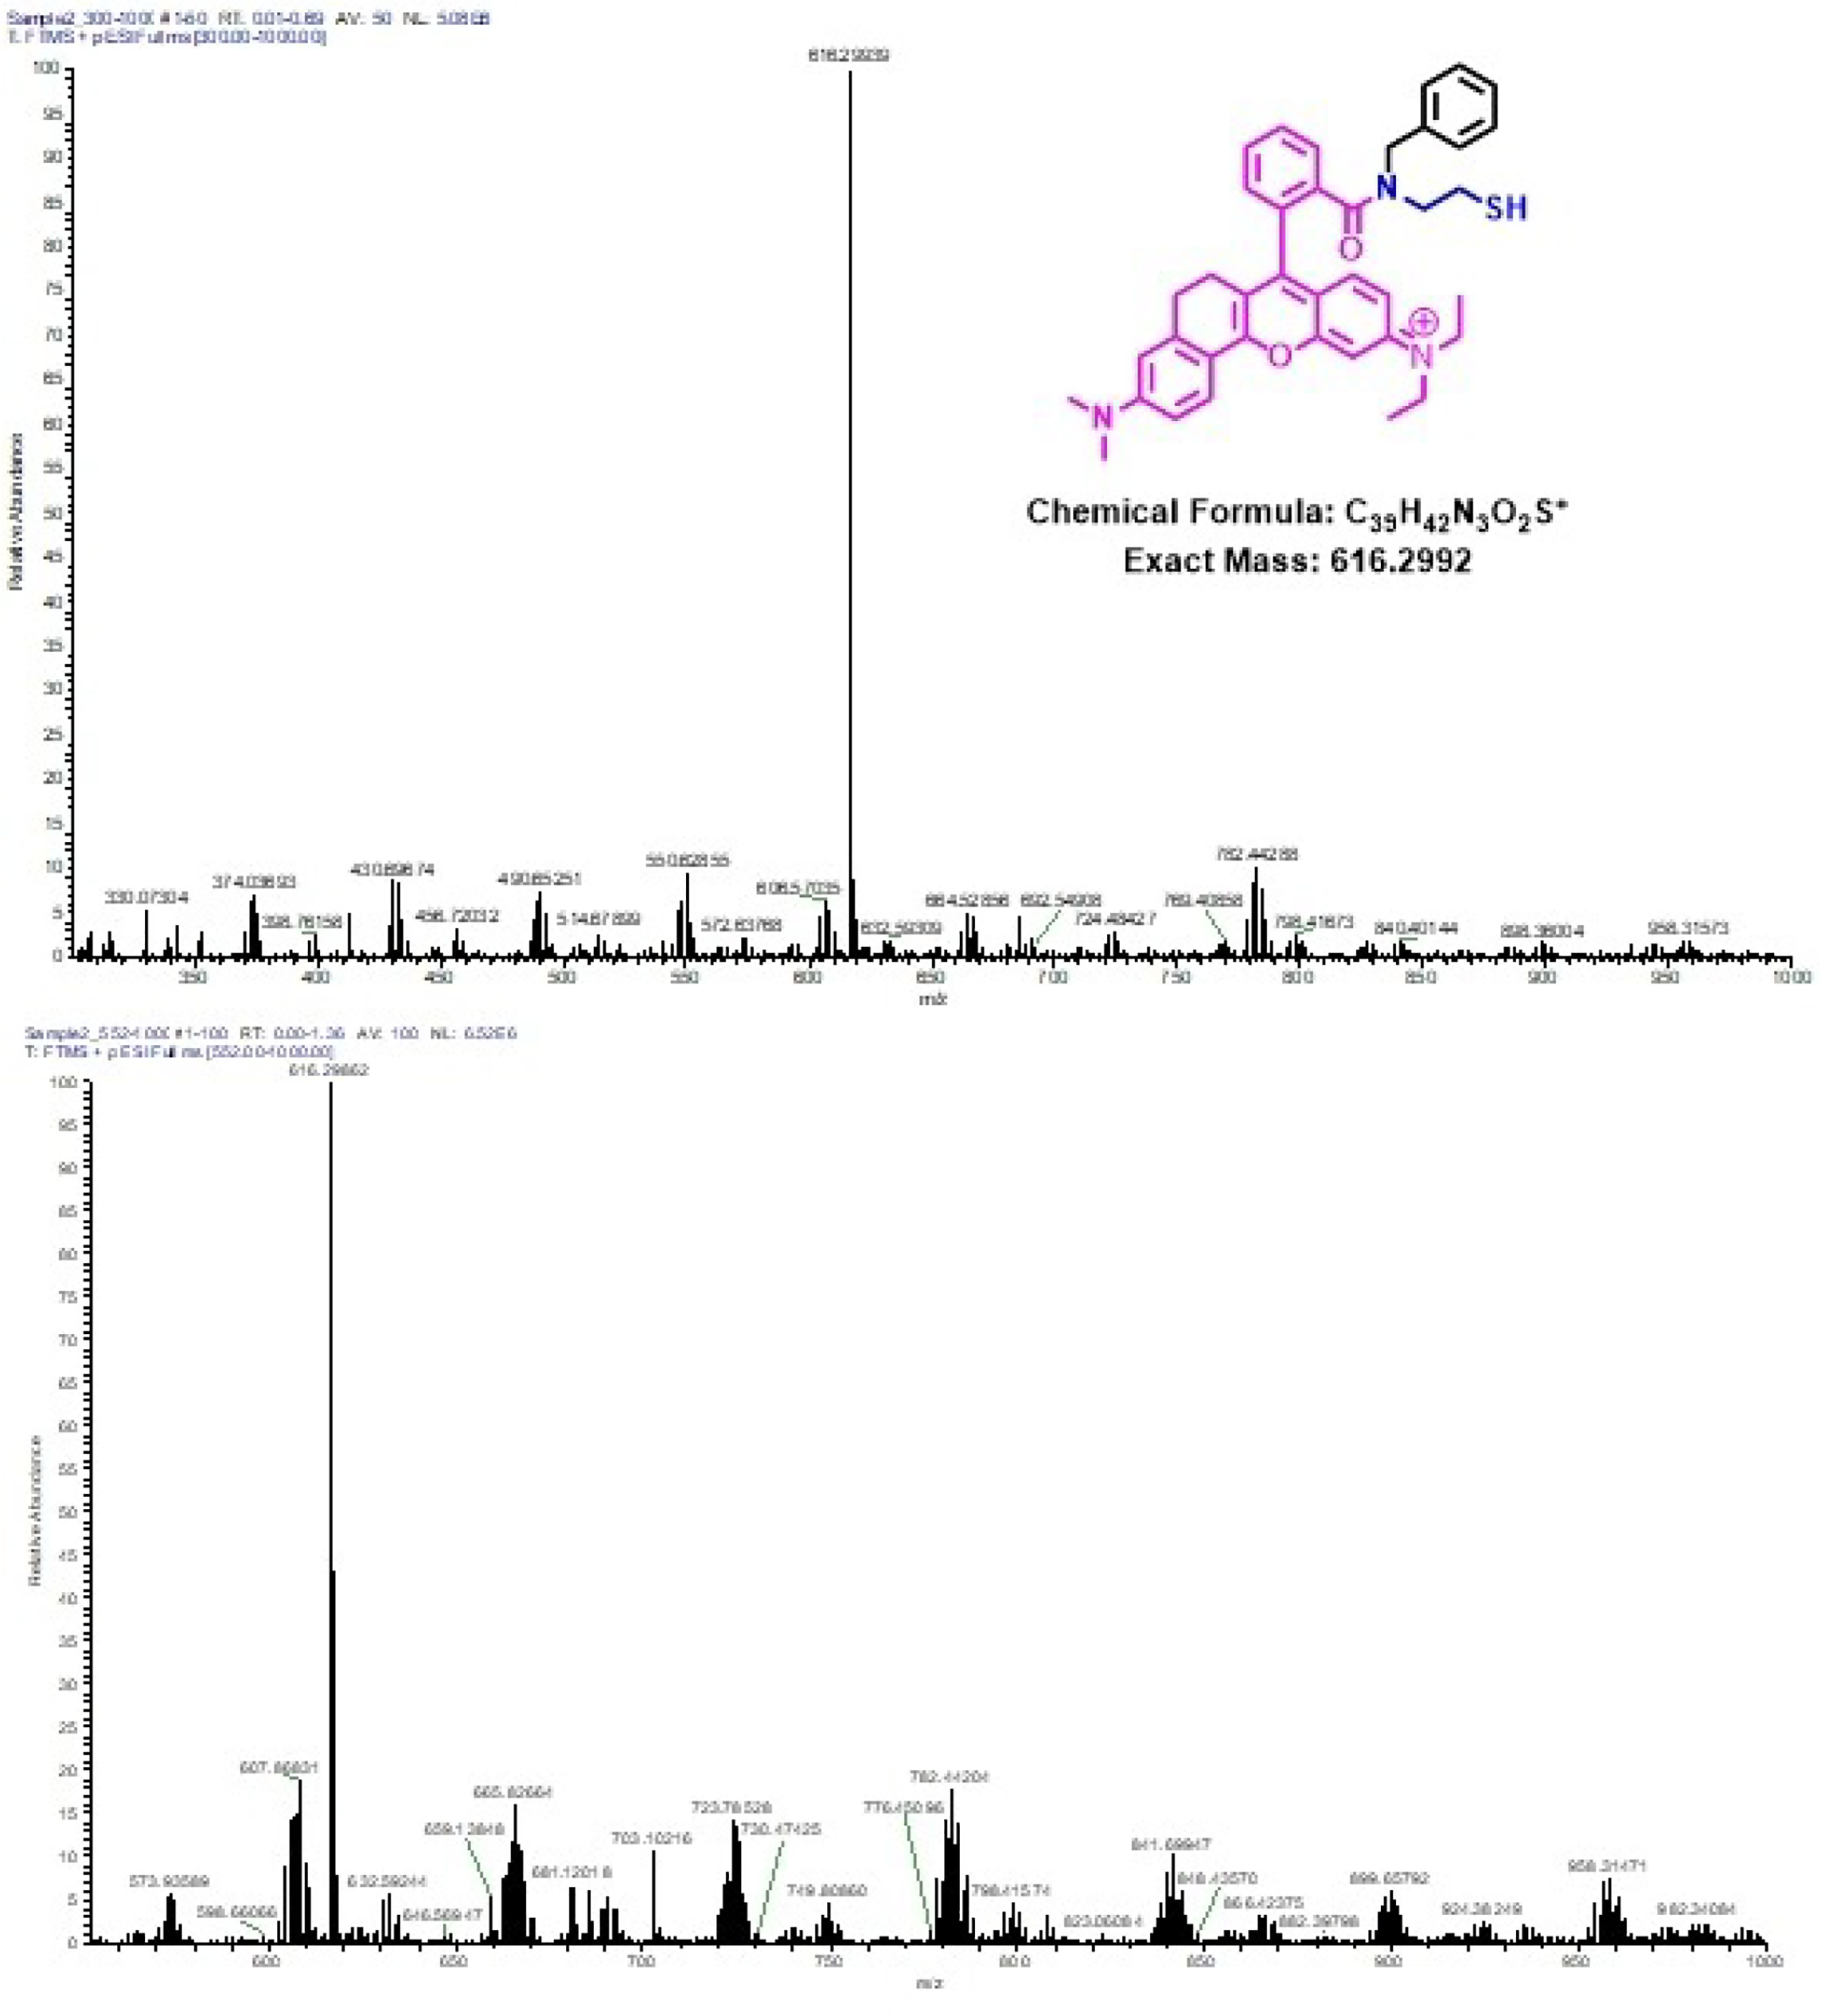
HR-MS spectrums of probe A reactions with DTT (top) and GSH (bottom).
To clarify the selectivity of probe A for GSH, we calculated the thermal energies of the starting acids and the final dimeric products, which would result after the cleavage of the S–S bond in probe A (Table 1). There is a clear thermodynamic preference (more energy released, 11.813 kcal/mol, see Table 1) for the effectiveness of DTT, as this results in the formation of a six-membered ring, as opposed to the other sulfur-containing compounds. Our calculation of the difference compares the thermal energies of the sum of two of the same acids and their coupled form since the energies of the products from probe A would be constant. Interestingly, GSH would appear to be the least favored of the four (listed in Table 1) in promoting the cleavage of the S–S bond in probe A. As there is no thermodynamic preference; we believe that aspects of solubility and possibly attraction between probe A and the substrate may contribute to the observed selectivity. We obtained the fluorescent spectra of probe A with different concentrations of GSH, Cys, Hcy, and DTT (Figures S13–S21). This revealed qualitatively that 100 μM DTT was equivalent to 100 μM GSH, Figure S13, but that comparable results with Cys were only obtained at the 1000-μM concentration level, Figures S14–S16. Additionally, 1000 μM HCY had a small effect comparatively speaking, Figures S17–S19. The superior reductive ability of GSH on probe A is displayed in a fluorescence wavelength ratiometric plot of 5 μM probe A with 100 μM of the other biothiols (i.e., DTT, Cys, and Hcy), Figure S20, and this was further confirmed by examining the rate of reduction on probe A with 500 μM GSH in comparison to 500 μM GSH with 500 μM Cys and 500 μM GSH with 500 μM Hcy, where no change in the reduction rate was observed, Figure S21.
Low cytotoxicity and good photostability of probe A
That our probe possesses low cytotoxicity is very important for its use in biological systems. The cytotoxicity of probe A was evaluated by a standard MTT assay, using different probe concentrations and a HeLa cell line. More than 85% cell viability was observed with the HeLa cells, when the cells were incubated with a high concentration of the probe at the 50 μM level, indicating that the probe possesses low cytotoxicity and good biocompatibility (Figure 10). We further conducted a photostability test. We illuminated probe A for 180 min at either the donor or acceptor wavelengths and in the absence and presence of GSH (Figure S22). The fluorescence intensity of the donor and acceptor remained nearly constant during the 3-hour test, proving that probe A is photo-stable.
Figure 10.
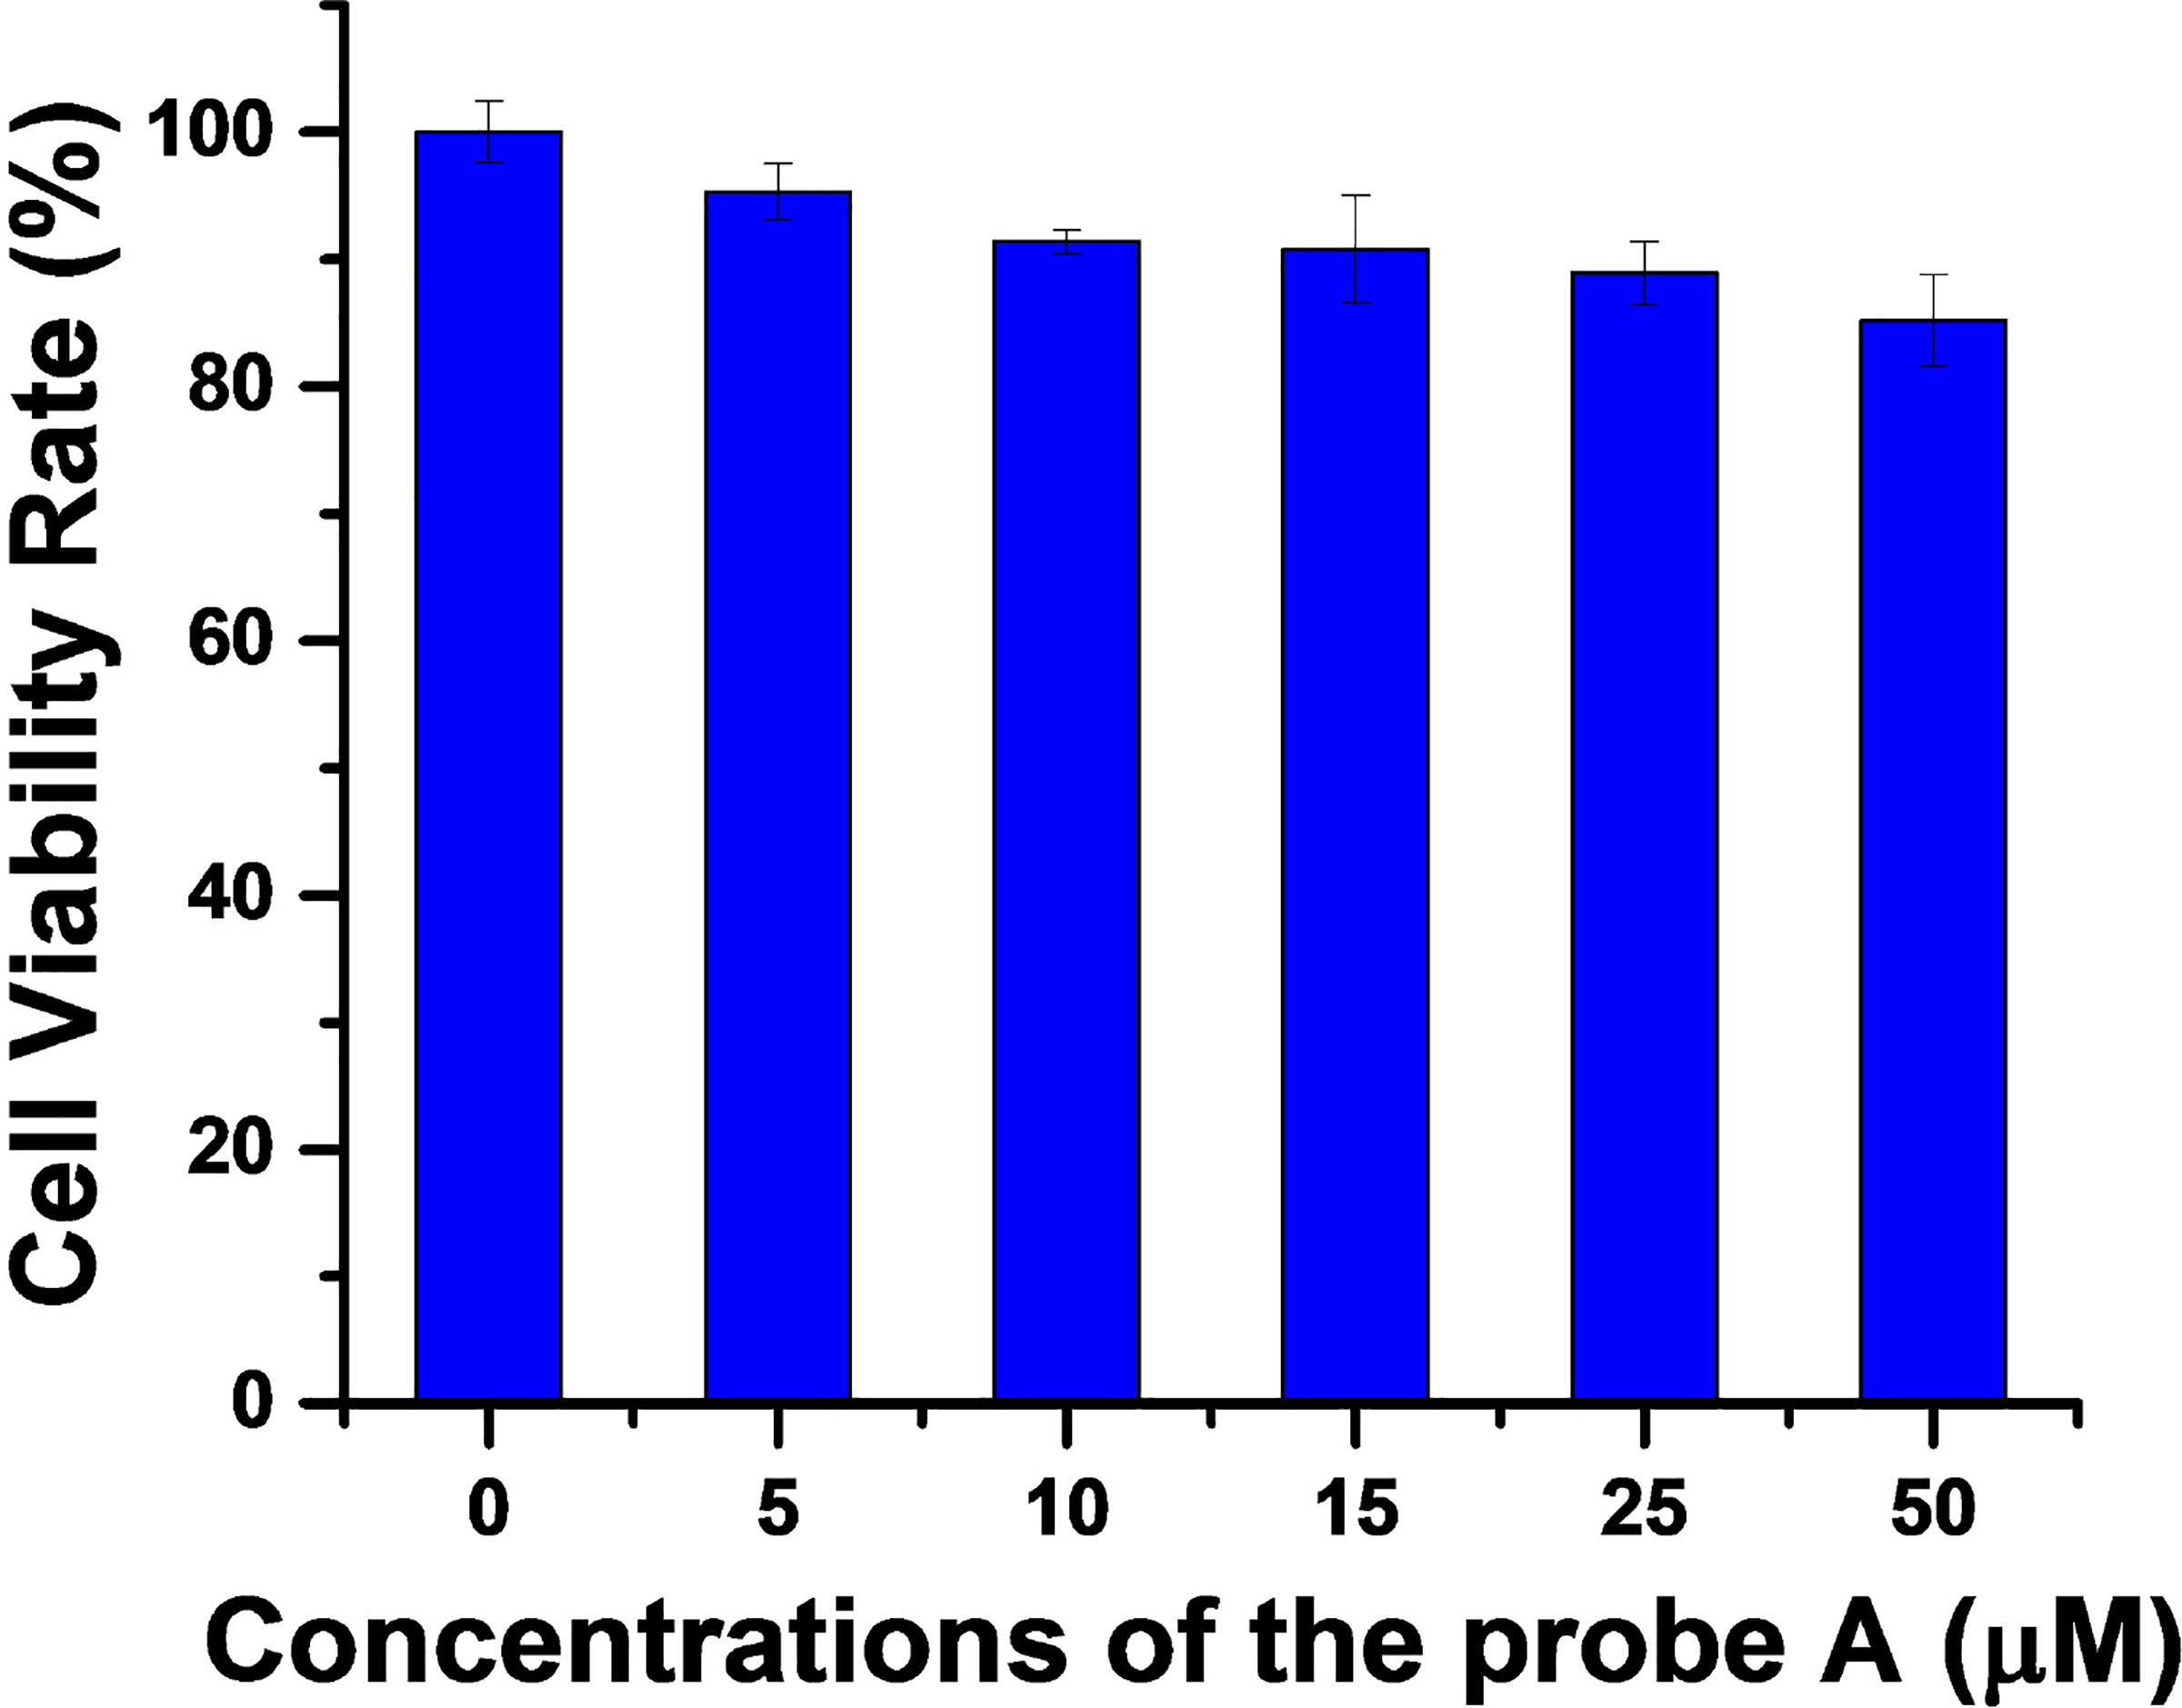
Cell viability under different concentrations of probe A obtained by MTT assay.
Cellular imaging of GSH in live cells
Probe A carries one positive charge in the rhodamine acceptor and is expected to specifically accumulate in the mitochondrial membrane in live cells via electrostatic interactions. To test if probe A indeed stains mitochondria, we performed a co-staining experiment, using both probe A and a known mitochondria-specific cyanine dye (IR-780) in HeLa cells.[11b,28] Strong rhodamine fluorescence and relatively weak coumarin fluorescence were observed under coumarin excitation at 405 nm. The Pearson’s colocalization coefficient between the coumarin fluorescence of probe A and cyanine fluorescence was 0.95, indicating that the probe specifically stains mitochondria in HeLa cells (Figure 11).[11b,28b]
Figure 11.
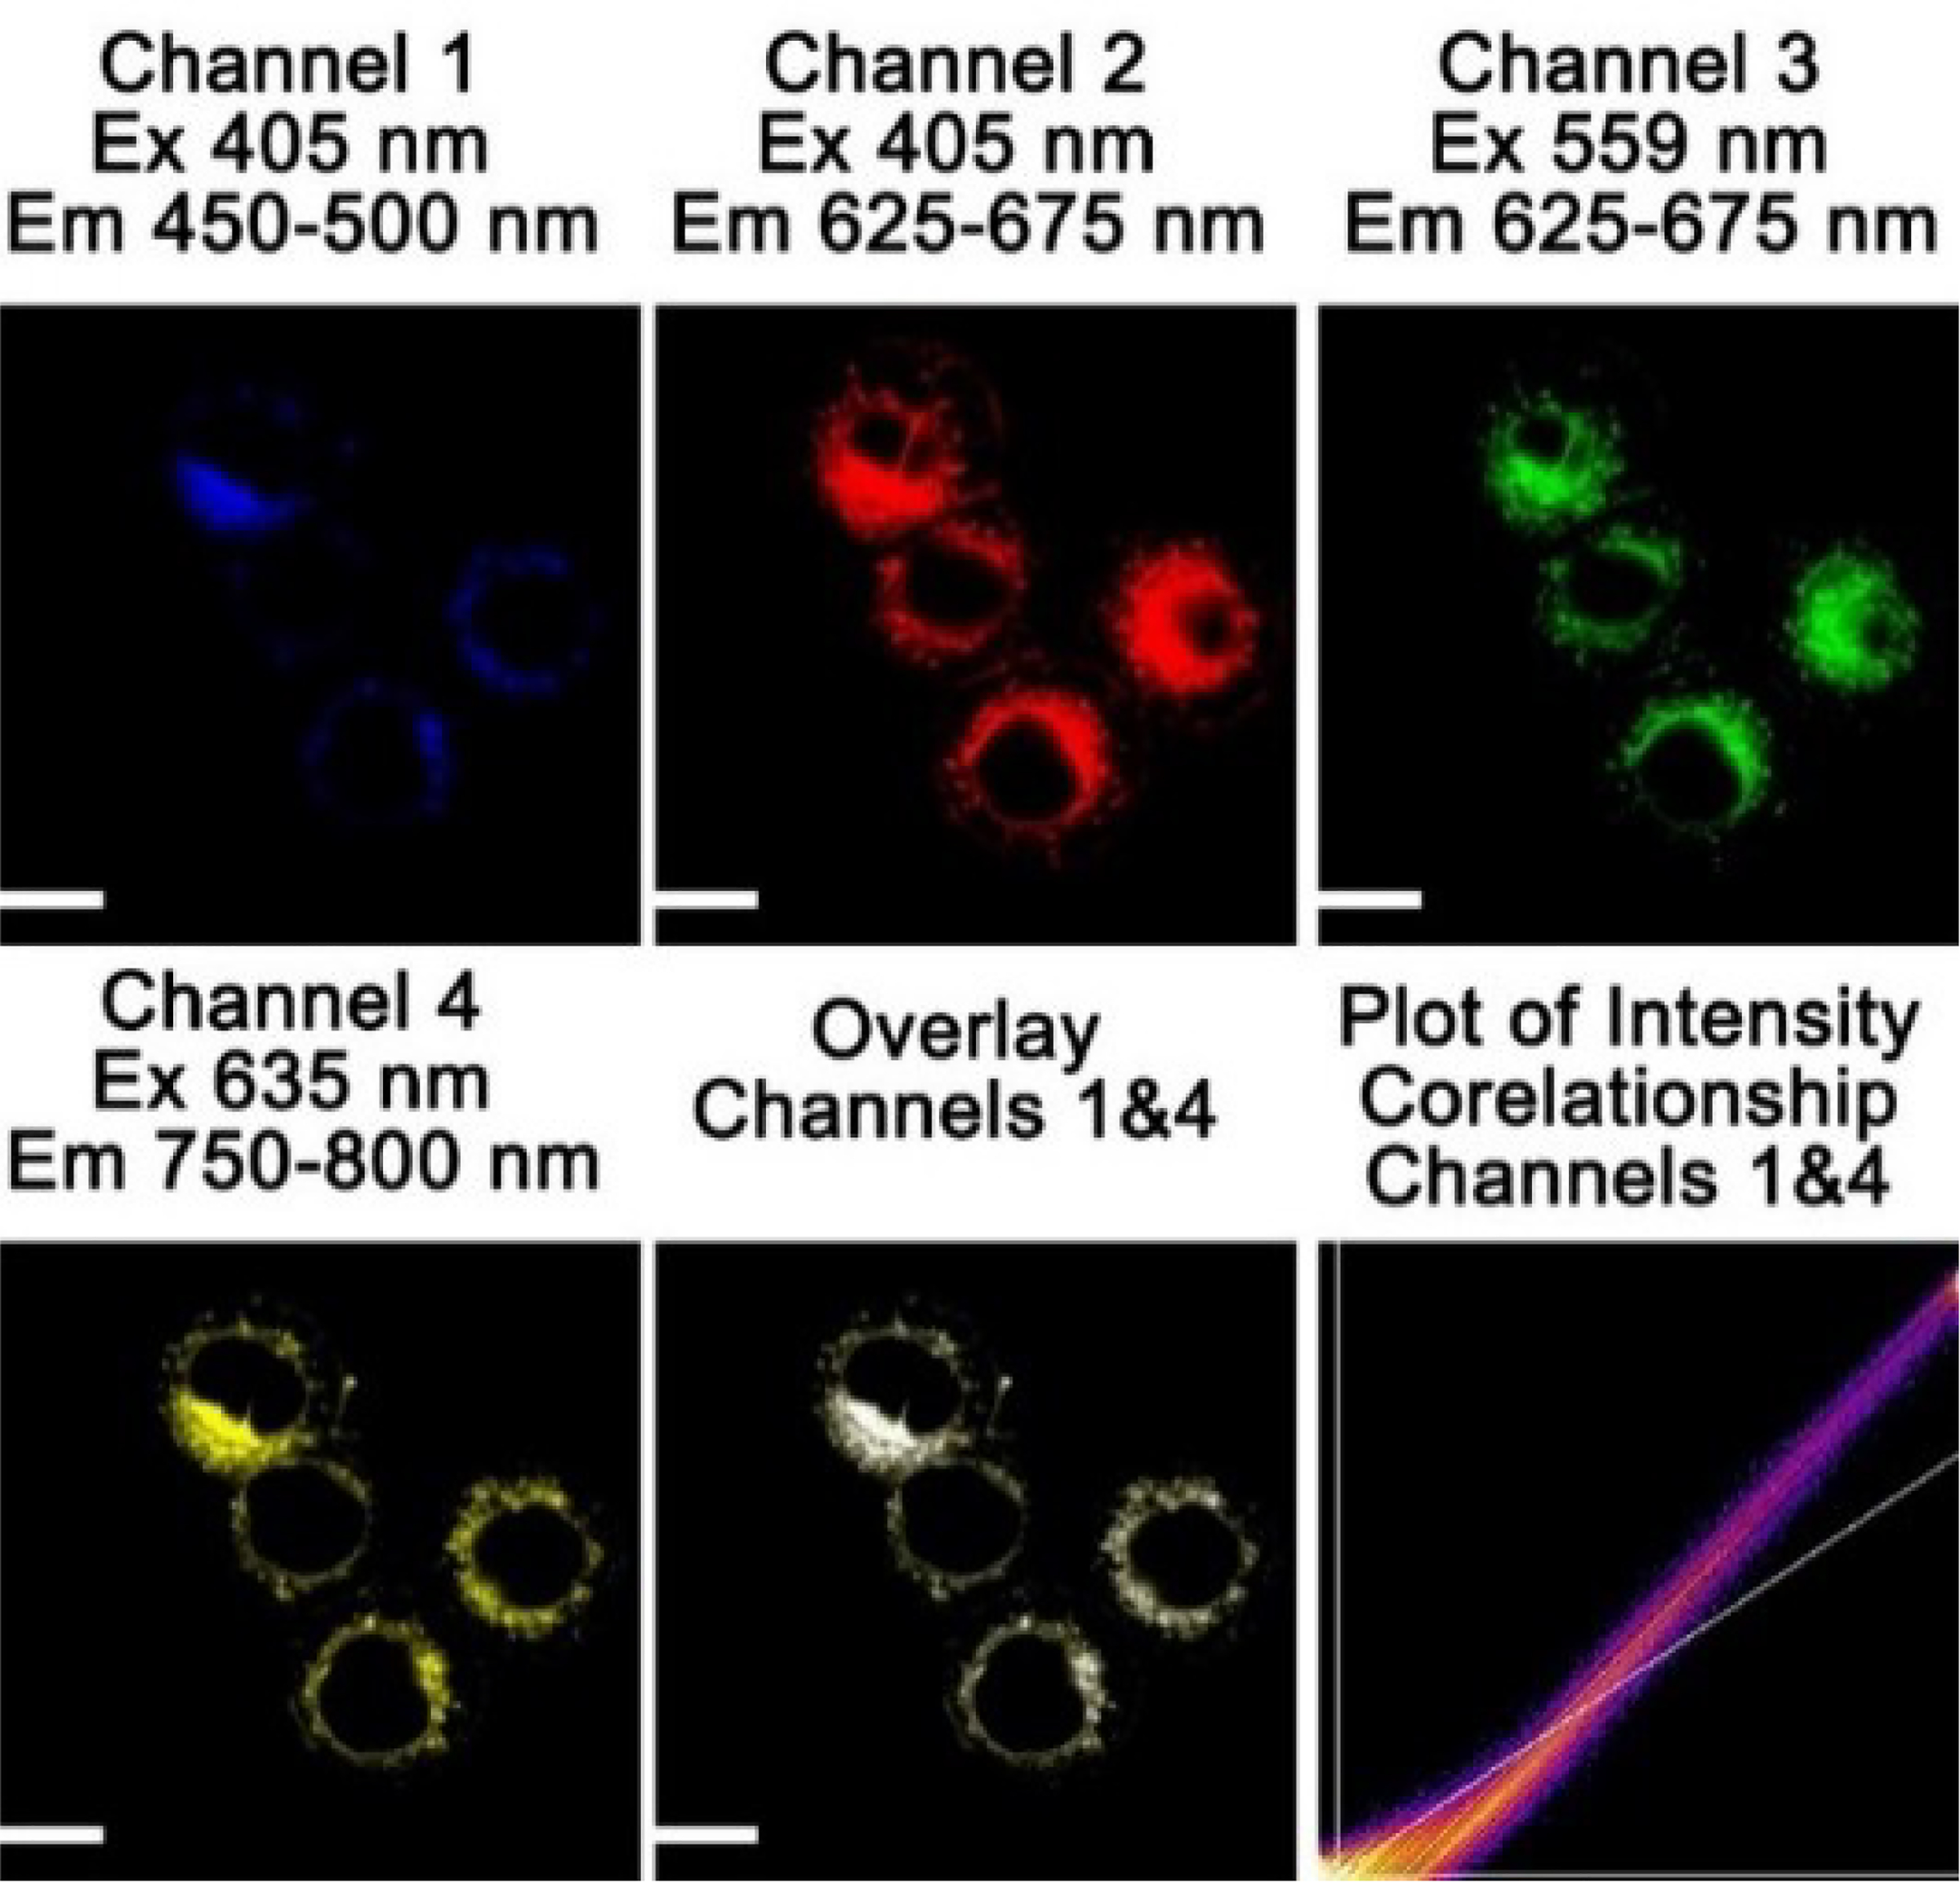
Cellular fluorescence images of HeLa cells incubated with 10 μM probe A and 5 μM cyanine dye (IR-780).[11b,28b] Scale bar: 20 μm.
Since the probe has excellent cell permeability and can selectively stain mitochondria, we tested if probe A could detect GSH concentration changes in living cells. The probe showed a strong cellular rhodamine fluorescence and a weaker coumarin fluorescence in HeLa cells as these do possess intracellular GSH. This observation indicates that intracellular GSH did not completely cleave the disulfide linkage in the probe as this would terminate FRET energy transfer from the coumarin donor to the rhodamine acceptor in the HeLa cells. In order to remove intracellular GSH through an addition reaction, we treated HeLa cells with 5 mM N-ethylmaleimide (NEM)[29] and then further incubated the HeLa cells with 10 μM concentration of probe A (Figure 12). Cellular rhodamine fluorescence became strong, while cellular coumarin fluorescence became weaker after the NME treatment of the HeLa cells, indicating that the NEM’s treatment effectively removes GSH in live cells enhancing the FRET energy transfer from the coumarin donor to the rhodamine acceptor (Figure 12).[29b] We also tested whether the probe could respond to GSH concentration increases by incubating HeLa cells with different GSH concentrations and 10 μM probe A. As a result, increased GSH concentrations in live cells significantly reduced rhodamine fluorescence and increased coumarin fluorescence (Figures 12 and S23), which was consistent with what was observed in buffer solutions, where increased GSH concentrations accelerated the reduction reaction of the probe’s disulfide bond, thus suppressing FRET energy transfer from the coumarin donor to the rhodamine acceptor. Thus, probe A responds to GSH concentration changes through GSH manipulation of the spacer distance between the donor and acceptor to control the efficacity of the energy transfer from the donor to the acceptor.
Figure 12.
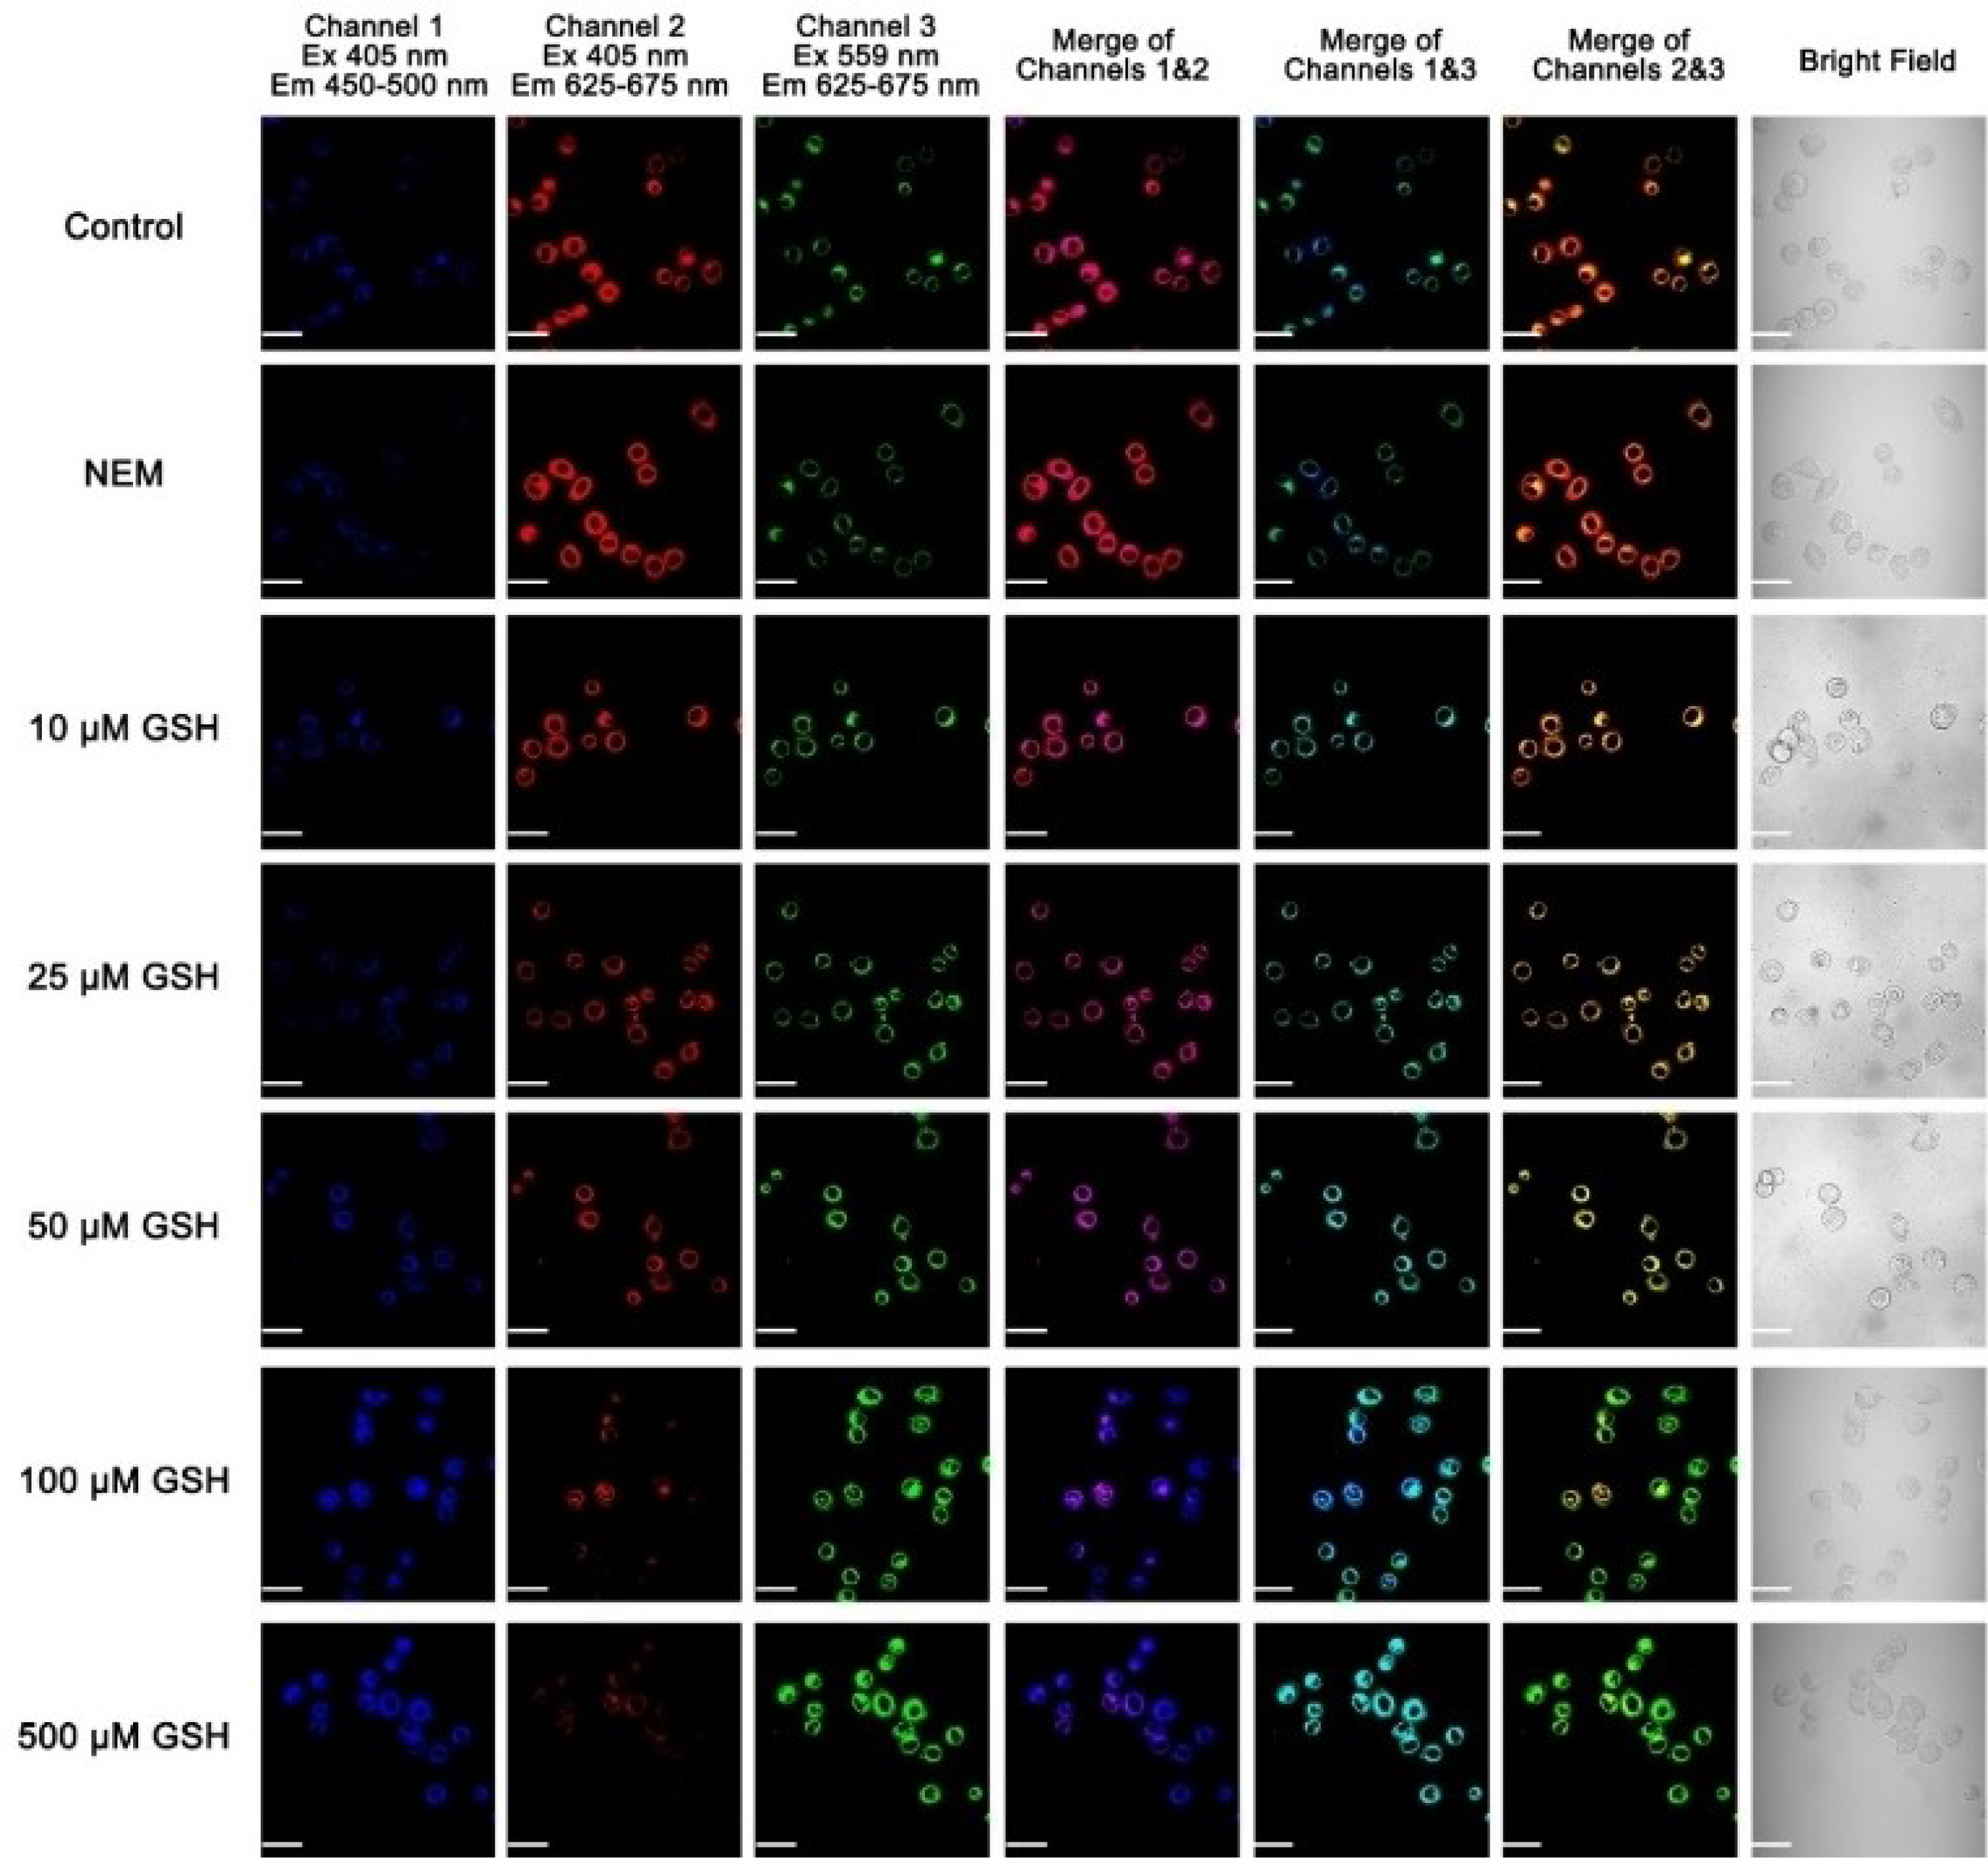
Cellular fluorescence images of HeLa cells incubated with 10 μM probe A before and after 5 mM NEM treatment or external GSH incubation. Scale bar: 50 μm.
Probe A performance test in D. melanogaster larvae
We further demonstrated the feasibility of using probe A to detect GSH concentration changes in D. melanogaster larvae (Figures 13 and S24). The larvae did not show any background fluorescence after they were incubated with 500 μM GSH. The probe displayed strong rhodamine fluorescence and weak coumarin fluorescence in the larvae under coumarin excitation at 405 nm. However, a GSH concentration increase resulted in a rhodamine fluorescence decrease and a coumarin fluorescence increase under coumarin excitation at 405 nm. Rhodamine fluorescence increased with GSH concentrations under rhodamine excitation at 559 nm, which is consistent with what was observed in HeLa cells, and the fluorescence spectra of probe A in buffer solutions with GSH concentration increases (Figures 5, 12, and 13).
Figure 13.
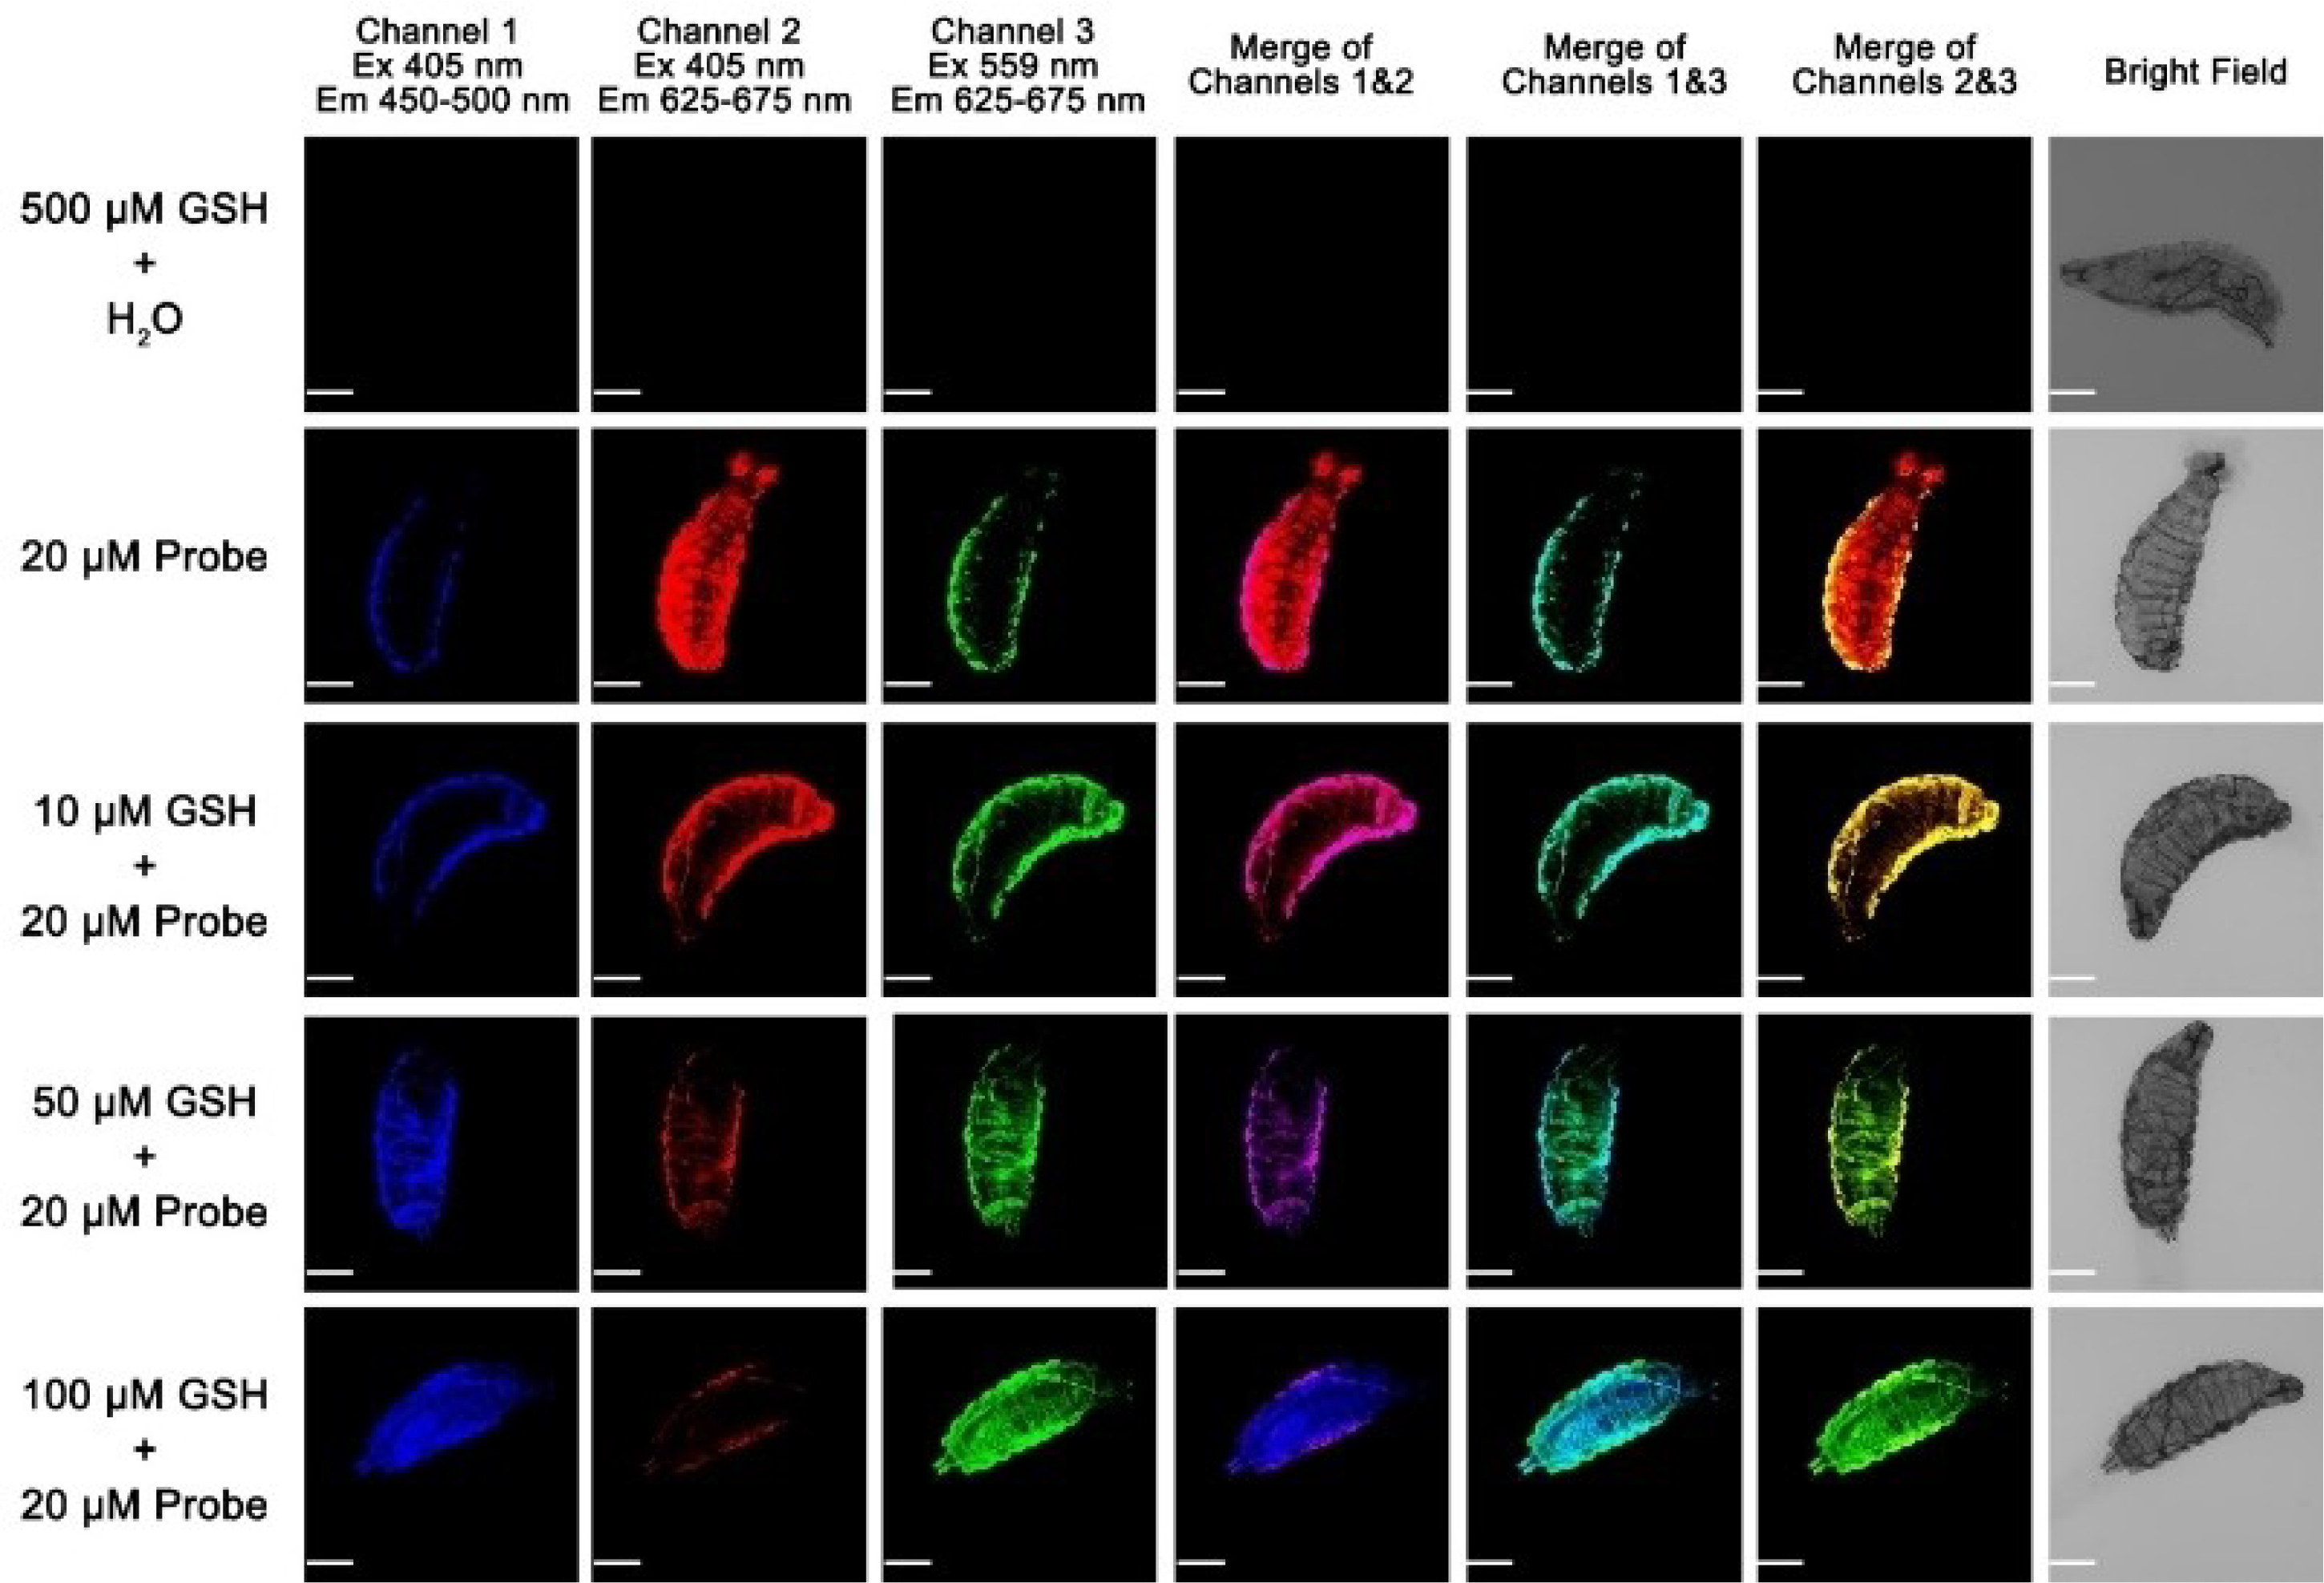
Cellular fluorescence images of D. melanogaster larvae incubated with 10 μM probe A before and after further external GSH incubation. Scale bar: 100 μm.
Conclusion
We developed a probe for ratiometric GSH detection through energy transfer manipulation from a coumarin donor to a near-infrared rhodamine acceptor. The presence of GSH effectively breaks a disulfide bond linker between the donor and acceptor, significantly suppressing the donor-to-acceptor energy transfer, resulting in a significant increase of coumarin fluorescence/decrease of the rhodamine acceptor. We successfully applied probe A to detect GSH in live cells and D. melanogaster larvae. We demonstrated that, in both biological systems, the intracellular fluorescence of the donor increased and that of the acceptor decreased when the GSH concentration was rising. These results confirm the feasibility of probe A for the detection of GSH in biological samples.
Supplementary Material
Acknowledgments
This research work was funded by the National Institute of General Medical Sciences of the National Institutes of Health under Award Number R15GM114751 and 2R15GM114751-02 (to H.Y. Liu). Superior, a high-performance computing system, was used to conduct the calculations. We acknowledge the assistance of Dr. Hans N. Lechner in proofreading this manuscript.
Footnotes
Conflict of Interest
The authors declare no conflict of interest.
Supporting information and the ORCID identification numbers for the authors of this article can be found under https://dx.doi.org/10.1002/cbic.202100108.
References
- [1].Gong D, Han S-C, Iqbal A, Qian J, Cao T, Liu W, Liu W, Qin W, Guo H, Anal. Chem. 2017, 89, 13112–13119. [DOI] [PubMed] [Google Scholar]
- [2].Wang Y, Zhu M, Jiang E, Hua R, Na R, Li QX, Sci. Rep. 2017, 7, 4377. [DOI] [PMC free article] [PubMed] [Google Scholar]
- [3].a) Zhai D, Lee S-C, Yun S-W, Chang Y-T, Chem. Commun. 2013, 49, 7207–7209; [DOI] [PubMed] [Google Scholar]; b) Yue YK, Huo FJ, Cheng FQ, Zhu XJ, Mafireyi T, Strongin RM, Yin CX, Chem. Soc. Rev. 2019, 48, 4155–4177. [DOI] [PubMed] [Google Scholar]
- [4].a) Lee S, Li J, Zhou X, Yin J, Yoon J, Coord. Chem. Rev. 2018, 366, 29–68; [Google Scholar]; b) Niu LY, Chen YZ, Zheng HR, Wu LZ, Tung CH, Yang QZ, Chem. Soc. Rev. 2015, 44, 6143–6160; [DOI] [PubMed] [Google Scholar]; c) Chen X, Zhou Y, Peng XJ, Yoon J, Chem. Soc. Rev. 2010, 39, 2120–2135; [DOI] [PubMed] [Google Scholar]; d) Abdillah A, Sonawane PM, Kim D, Mametov D, Shimodaira S, Park Y, Churchill DG, Molecules 2021, 26, 692; [DOI] [PMC free article] [PubMed] [Google Scholar]; e) Zhang J, Wang NN, Ji X, Tao YF, Wang JM, Zhao WL, Chem. Eur. J. 2020, 26, 4172–4192; [DOI] [PubMed] [Google Scholar]; f) Gao P, Pan W, Li N, Tang B, Chem. Sci. 2019, 10, 6035–6071; [DOI] [PMC free article] [PubMed] [Google Scholar]; g) Xu ZY, Qin TY, Zhou XF, Wang L, Liu B, TrAC Trends Anal. Chem. 2019, 121; [Google Scholar]; h) Dai JN, Ma CG, Zhang P, Fu YQ, Shen BX, Dyes Pigm. 2020, 177; [Google Scholar]; i) Chen DG, Feng YZ, Crit. Rev. Anal. Chem. 2020, 1–18, DOI: 10.1080/10408347.2020.1819193; [DOI] [Google Scholar]; j) Chen H, Tang YH, Lin WY, TrAC Trends Anal. Chem. 2016, 76, 166–181. [Google Scholar]
- [5].a) Liu C-P, Wu T-H, Liu C-Y, Lin S-Y, Anal. Chim. Acta 2014, 849, 57–63; [DOI] [PubMed] [Google Scholar]; b) Mulay SV, Kim Y, Choi M, Lee DY, Choi J, Lee Y, Jon S, Churchill DG, Anal. Chem. 2018, 90, 2648–2654; [DOI] [PubMed] [Google Scholar]; c) Sun YQ, Liu J, Zhang HX, Huo YY, Lv X, Shi YW, Guo W, J. Am. Chem. Soc. 2014, 136, 12520–12523; [DOI] [PubMed] [Google Scholar]; d) Chen XX, Niu LY, Shao N, Yang QZ, Anal. Chem. 2019, 91, 4301–4306. [DOI] [PubMed] [Google Scholar]
- [6].a) Chen F, Zhang J, Qu W, Zhong X, Liu H, Ren J, He H, Zhang X, Wang S, Sens. Actuators B 2018, 266, 528–533; [Google Scholar]; b) Hou X, Guo X, Chen B, Liu C, Gao F, Zhao J, Wang J, Sens. Actuators B 2015, 209, 838–845; [Google Scholar]; c) Niu L-Y, Guan Y-S, Chen Y-Z, Wu L-Z, Tung C-H, Yang Q-Z, J. Am. Chem. Soc. 2012, 134, 18928–18931; [DOI] [PubMed] [Google Scholar]; d) Chen JW, Jiang XQ, Zhang CW, MacKenzie KR, Stossi F, Palzkill T, Wang MC, Wang J, ACS Sens. 2017, 2, 1257–1261; [DOI] [PMC free article] [PubMed] [Google Scholar]; e) Jiang XQ, Yu Y, Chen JW, Zhao MK, Chen H, Song XZ, Matzuk AJ, Carroll SL, Tan X, Sizovs A, Cheng NH, Wang MC, Wang J, ACS Chem. Biol. 2015, 10, 864–874. [DOI] [PMC free article] [PubMed] [Google Scholar]
- [7].He LW, Xu QY, Liu Y, Wei HP, Tang YH, Lin WY, ACS Appl. Mater. Interfaces 2015, 7, 12809–12813. [DOI] [PubMed] [Google Scholar]
- [8].Zhou Y, Zhang L, Zhang X, Zhu Z-J, J. Mater. Chem. B 2019, 7, 809–814. [DOI] [PubMed] [Google Scholar]
- [9].Xia S, Zhang YB, Fang MX, Mikesell L, Steenwinkel TE, Wan SL, Phillips T, Luck RL, Werner T, Liu HY, ChemBioChem 2019, 20, 1986–1994. [DOI] [PMC free article] [PubMed] [Google Scholar]
- [10].Yuan L, Lin WY, Zheng KB, Zhu SS, Acc. Chem. Res. 2013, 46, 1462–1473. [DOI] [PubMed] [Google Scholar]
- [11].a) Gryczynski Z, Gryczynski I, Lakowicz JR, Methods Enzymol. Vol. 360, Academic Press, 2003, pp. 44–75; [DOI] [PubMed] [Google Scholar]; b) Wang L, Wang JB, Xia S, Wang XX, Yu YT, Zhou HW, Liu HY, Talanta 2020, 219. [DOI] [PubMed] [Google Scholar]
- [12].Kitayama Y, Takeuchi T, Chem. Eur. J. 2017, 23, 12870–12875. [DOI] [PubMed] [Google Scholar]
- [13].Martinez-Cuezva A, Lopez-Leonardo C, Bautista D, Alajarin M, Berna J, J. Am. Chem. Soc. 2016, 138, 8726–8729. [DOI] [PubMed] [Google Scholar]
- [14].Niu G, Zhang P, Liu W, Wang M, Zhang H, Wu J, Zhang L, Wang P, Anal. Chem. 2017, 89, 1922–1929. [DOI] [PubMed] [Google Scholar]
- [15].a) Xia S, Wang JB, Bi JH, Wang X, Fang MX, Phillips T, May A, Conner N, Tanasova M, Luo FT, Liu HY, Sens. Actuators 2018, 265, 699–708; [DOI] [PMC free article] [PubMed] [Google Scholar]; b) Wang JB, Xia S, Bi JH, Zhang YB, Fang MX, Luck RL, Zeng YB, Chen TH, Lee HM, Liu HY, J. Mater. Chem. B 2019, 7, 198–209; [DOI] [PMC free article] [PubMed] [Google Scholar]; c) Xia S, Fang MX, Wang JB, Bi JH, Mazi W, Zhang YB, Luck RL, Liu HY, Sens. Actuators 2019, 294, 1–13; [DOI] [PMC free article] [PubMed] [Google Scholar]; d) Zhang YB, Xia S, Fang MX, Mazi W, Zeng YB, Johnston T, Pap A, Luck RL, Liu HY, Chem. Commun. 2018, 54, 7625–7628; [DOI] [PMC free article] [PubMed] [Google Scholar]; e) Wang JB, Xia S, Bi JH, Fang MX, Mazi WF, Zhang YB, Conner N, Luo FT, Lu HP, Liu HY, Bioconjugate Chem. 2018, 29, 1406–1418. [DOI] [PMC free article] [PubMed] [Google Scholar]
- [16].Zhang Y, Bi J, Xia S, Mazi W, Wan S, Mikesell L, Luck RL, Liu H, Molecules 2018, 23, 2679/2671–2679/2615. [DOI] [PMC free article] [PubMed] [Google Scholar]
- [17].ChemBio3D, http://www.cambridgesoft.com/software/chembio3d,2012.
- [18].Hanwell MD, Curtis DE, Lonie DC, Vandermeersch T, Zurek E, Hutchison GR, J. Cheminformatics 2012, 4, 17. [DOI] [PMC free article] [PubMed] [Google Scholar]
- [19].Austin A, Petersson GA, Frisch MJ, Dobek FJ, Scalmani G, Throssell K, Chem J. Theory Comput. 2012, 8, 4989–5007. [DOI] [PubMed] [Google Scholar]
- [20].Frisch MJ, Trucks GW, Schlegel HB, Scuseria GE, Robb MA, Cheeseman JR, Scalmani G, Barone V, Mennucci B, Petersson GA, Nakatsuji H, Caricato M, Li X, Hratchian HP, Izmaylov AF, Bloino J, Zheng G, Sonnenberg JL, Hada M, Ehara M, Toyota K, Fukuda R, Hasegawa J, Ishida M, Nakajima T, Honda Y, Kitao O, Nakai H, Vreven T, Montgomery JA, Peralta JE, Ogliaro F, Bearpark MJ, Heyd JJ, Brothers EN, Kudin KN, Staroverov VN, Kobayashi R, Normand J, Raghavachari K, Rendell A, Burant JC, Iyengar SS, Tomasi J, Cossi M, Rega N, Millam JM, Klene M, Knox JE, Cross JB, Bakken V, Adamo C, Jaramillo J, Gomperts R, Stratmann RE, Yazyev O, Austin AJ, Cammi R, Pomelli C, Ochterski JW, Martin RL, Morokuma K, Zakrzewski VG, Voth GA, Salvador P, Dannenberg JJ, Dapprich S, Daniels AD, Farkas Ö, Foresman JB, Ortiz JV, Cioslowski J, Fox DJ, Gaussian 16, Revision A.03. Gaussian, Inc., Wallingford CT, 2016. [Google Scholar]
- [21].Casida ME, Jamorski C, Casida KC, Salahub DR, J. Chem. Phys. 1998, 108, 4439–4449. [Google Scholar]
- [22].Cances E, Mennucci B, Tomasi J, J. Chem. Phys. 1997, 107, 3032–3041. [Google Scholar]
- [23].GaussView V 6, Dennington R, Keith TA, Millam JM, Semichem Inc. Shawnee Mission, KS, 2016. [Google Scholar]
- [24].Zhao Y, Truhlar DG, Theor. Chem. Acc. 2008, 120, 215–241. [Google Scholar]
- [25].Abdillah A, Sonawane PM, Kim D, Mametov D, Shimodaira S, Park Y, Churchill DG, Molecules 2021, 26, 692. [DOI] [PMC free article] [PubMed] [Google Scholar]
- [26].Niu GL, Zhang PP, Liu WM, Wang MQ, Zhang HY, Wu JS, Zhang LP, Wang PF, Anal. Chem. 2017, 89, 1922–1929. [DOI] [PubMed] [Google Scholar]
- [27].Hilborn RC, Am. J. Phys. 1982, 50, 982–986. [Google Scholar]
- [28].a) Jiang Q, Zhang C, Wang H, Peng T, Zhang L, Wang Y, Han W, Shi C, Front. Oncol. 2019, 9, 1196; [DOI] [PMC free article] [PubMed] [Google Scholar]; b) Wang Y, Liu T, Zhang EL, Luo SL, Tan X, Shi CM, Biomaterials 2014, 35, 4116–4124 [DOI] [PubMed] [Google Scholar]
- [29].a) Giustarini D, Dalle-Donne I, Milzani A, Rossi R, Anal. Biochem. 2011, 415, 81–83; [DOI] [PubMed] [Google Scholar]; b) Peng HJ, Chen WX, Cheng YF, Hakuna L, Strongin R, Wang BH, Sensors 2012, 12, 15907–15946. [DOI] [PMC free article] [PubMed] [Google Scholar]
Associated Data
This section collects any data citations, data availability statements, or supplementary materials included in this article.