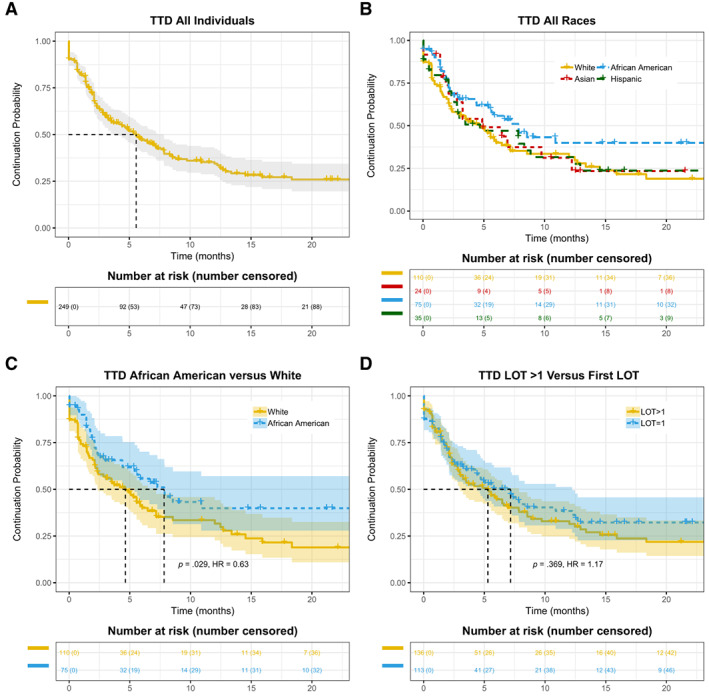
Figure 1.

Kaplan‐Meier curves of TTD in patients with advanced non‐small cell lung cancer treated with anti‐programmed death 1/programmed death‐ligand 1 antibodies. (A): The entire cohort. (B): Patients stratified by race and ethnicity. (C): Comparison between African American versus White patients. (D): Patients stratified by lines of therapy. Abbreviations: HR, hazard ratio; LOT, line of treatment; TTD, time‐to‐treatment discontinuation.
