
FIG 4.
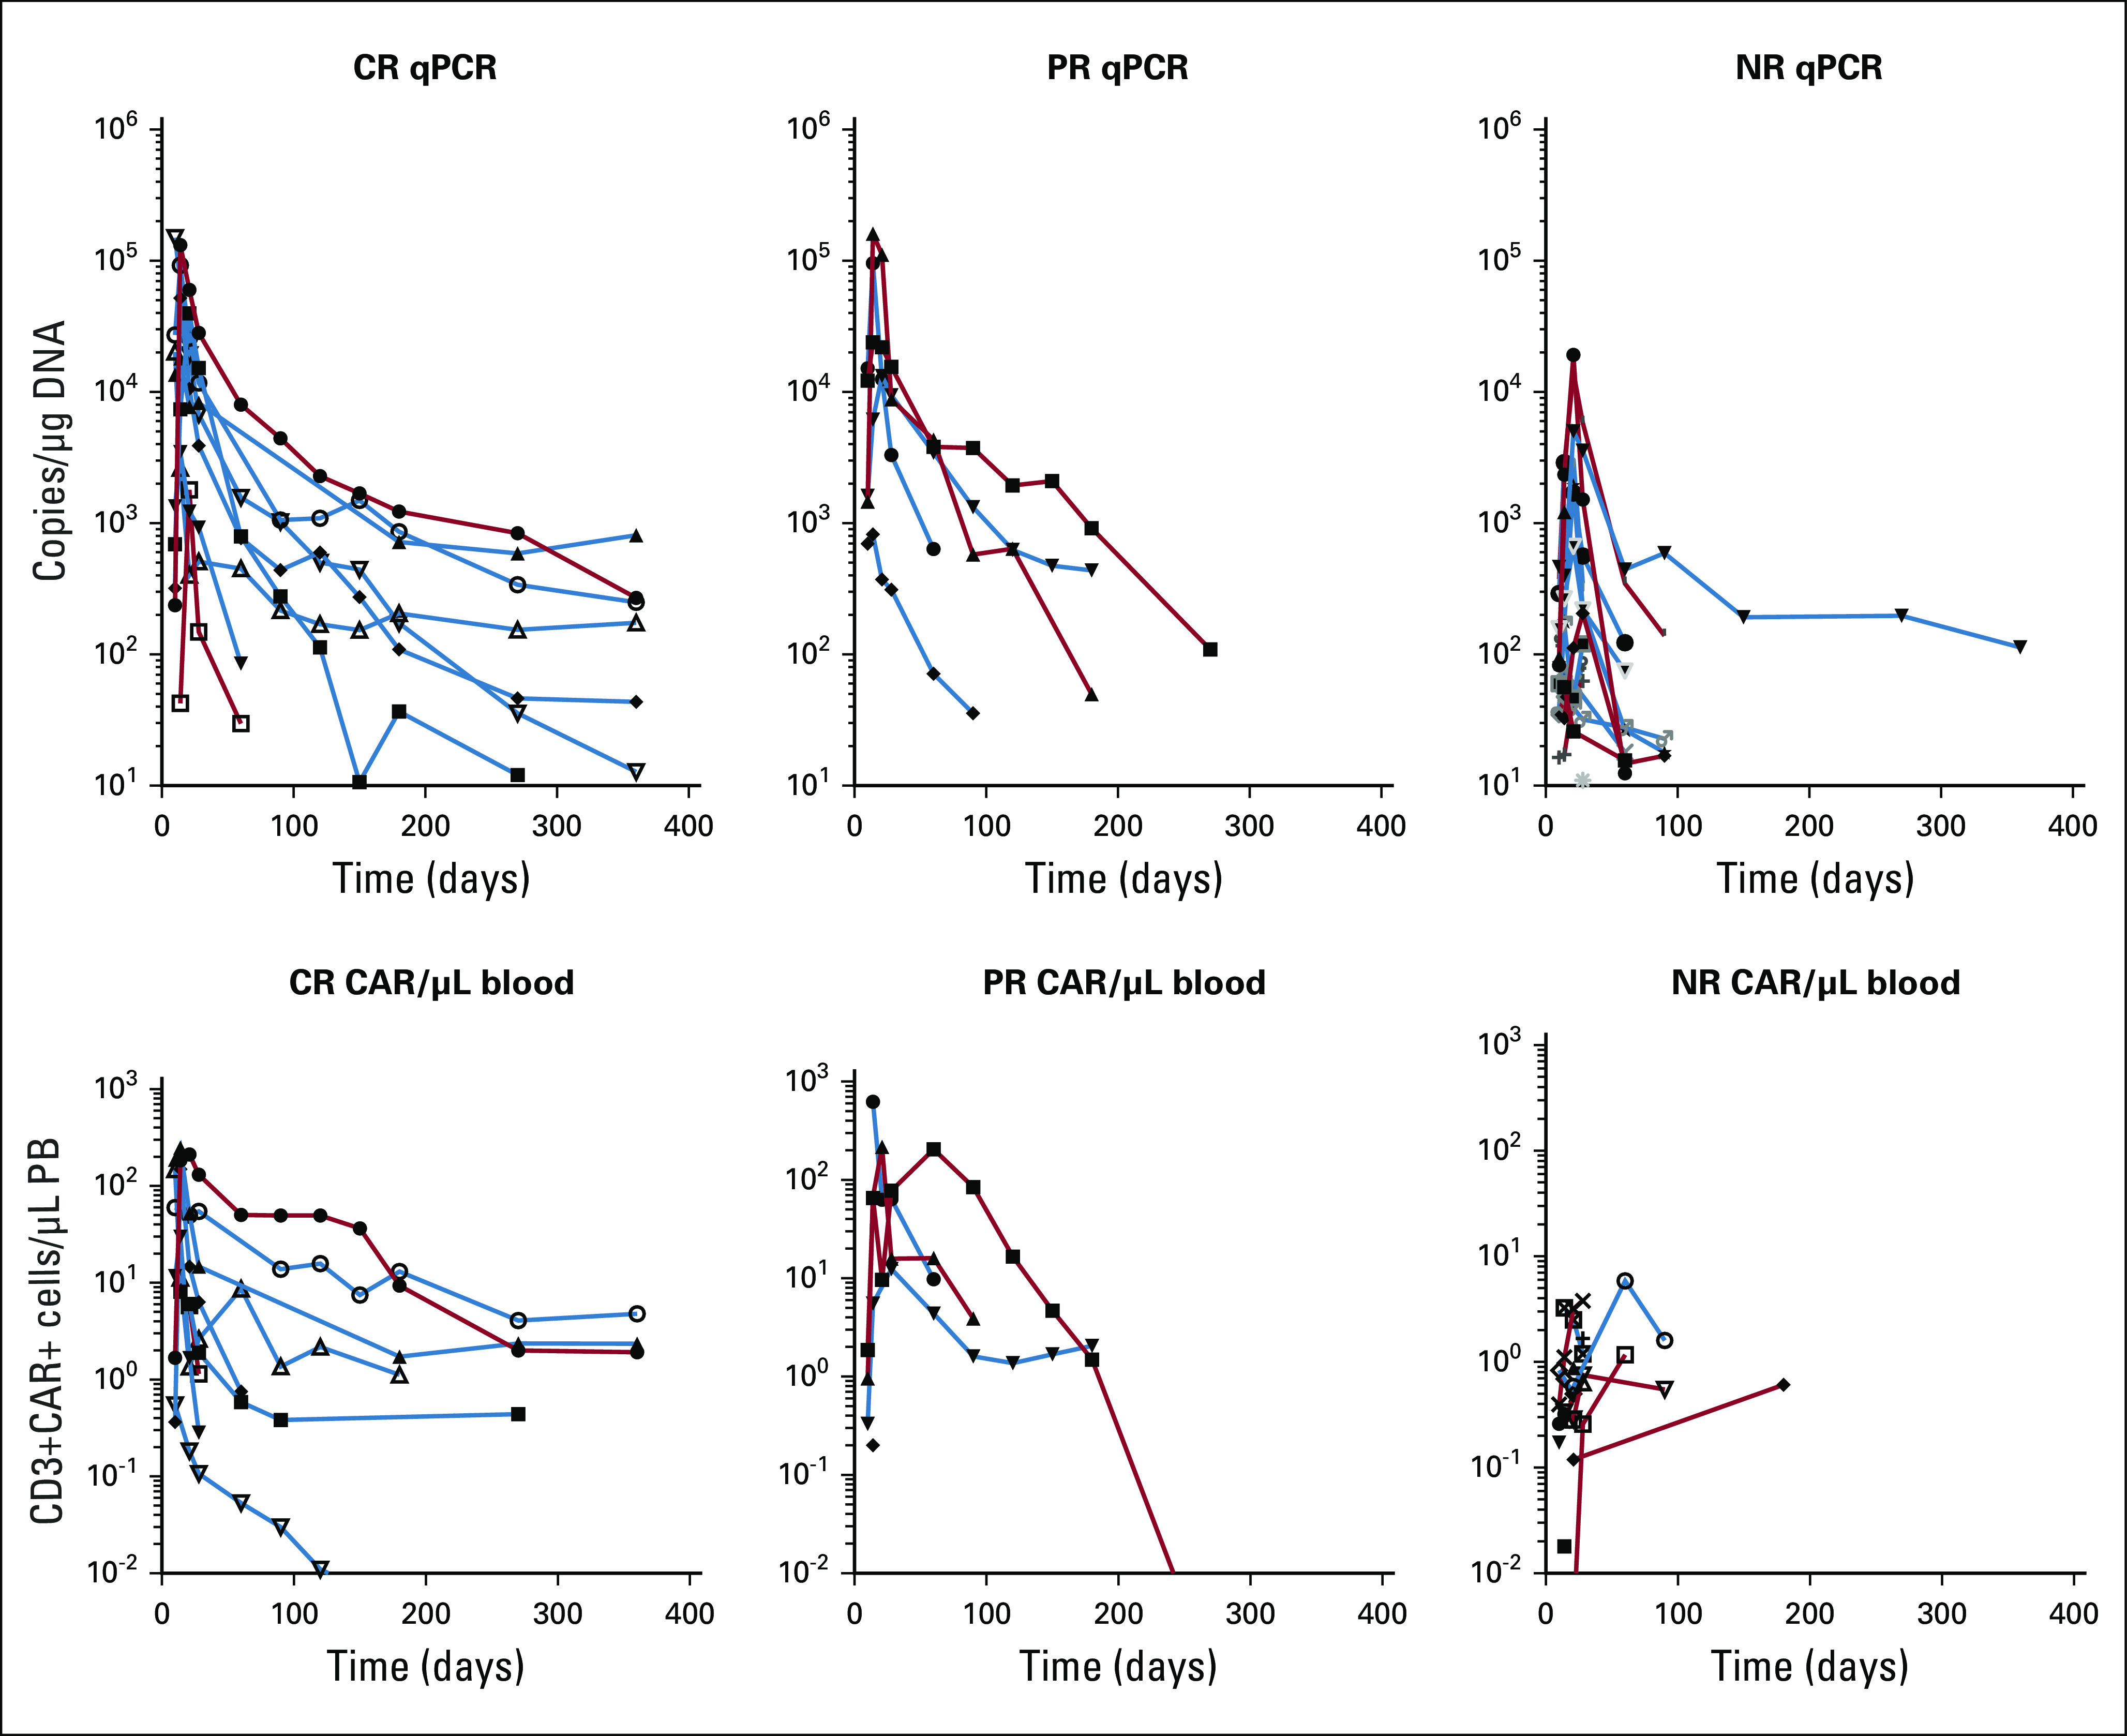
Expansion and persistence of CART-19 cells. CAR T cells were quantified by quantitative polymerase chain reaction (qPCR; top) or flow cytometry (bottom) and charted for patients whose disease achieved a complete response (CR), partial response (PR), or no response (NR). Within each panel, data of patients who received the high dose of CART-19 cells are indicated in blue, and data of those receiving the low dose of CART-19 cells are in red. PB, peripheral blood.