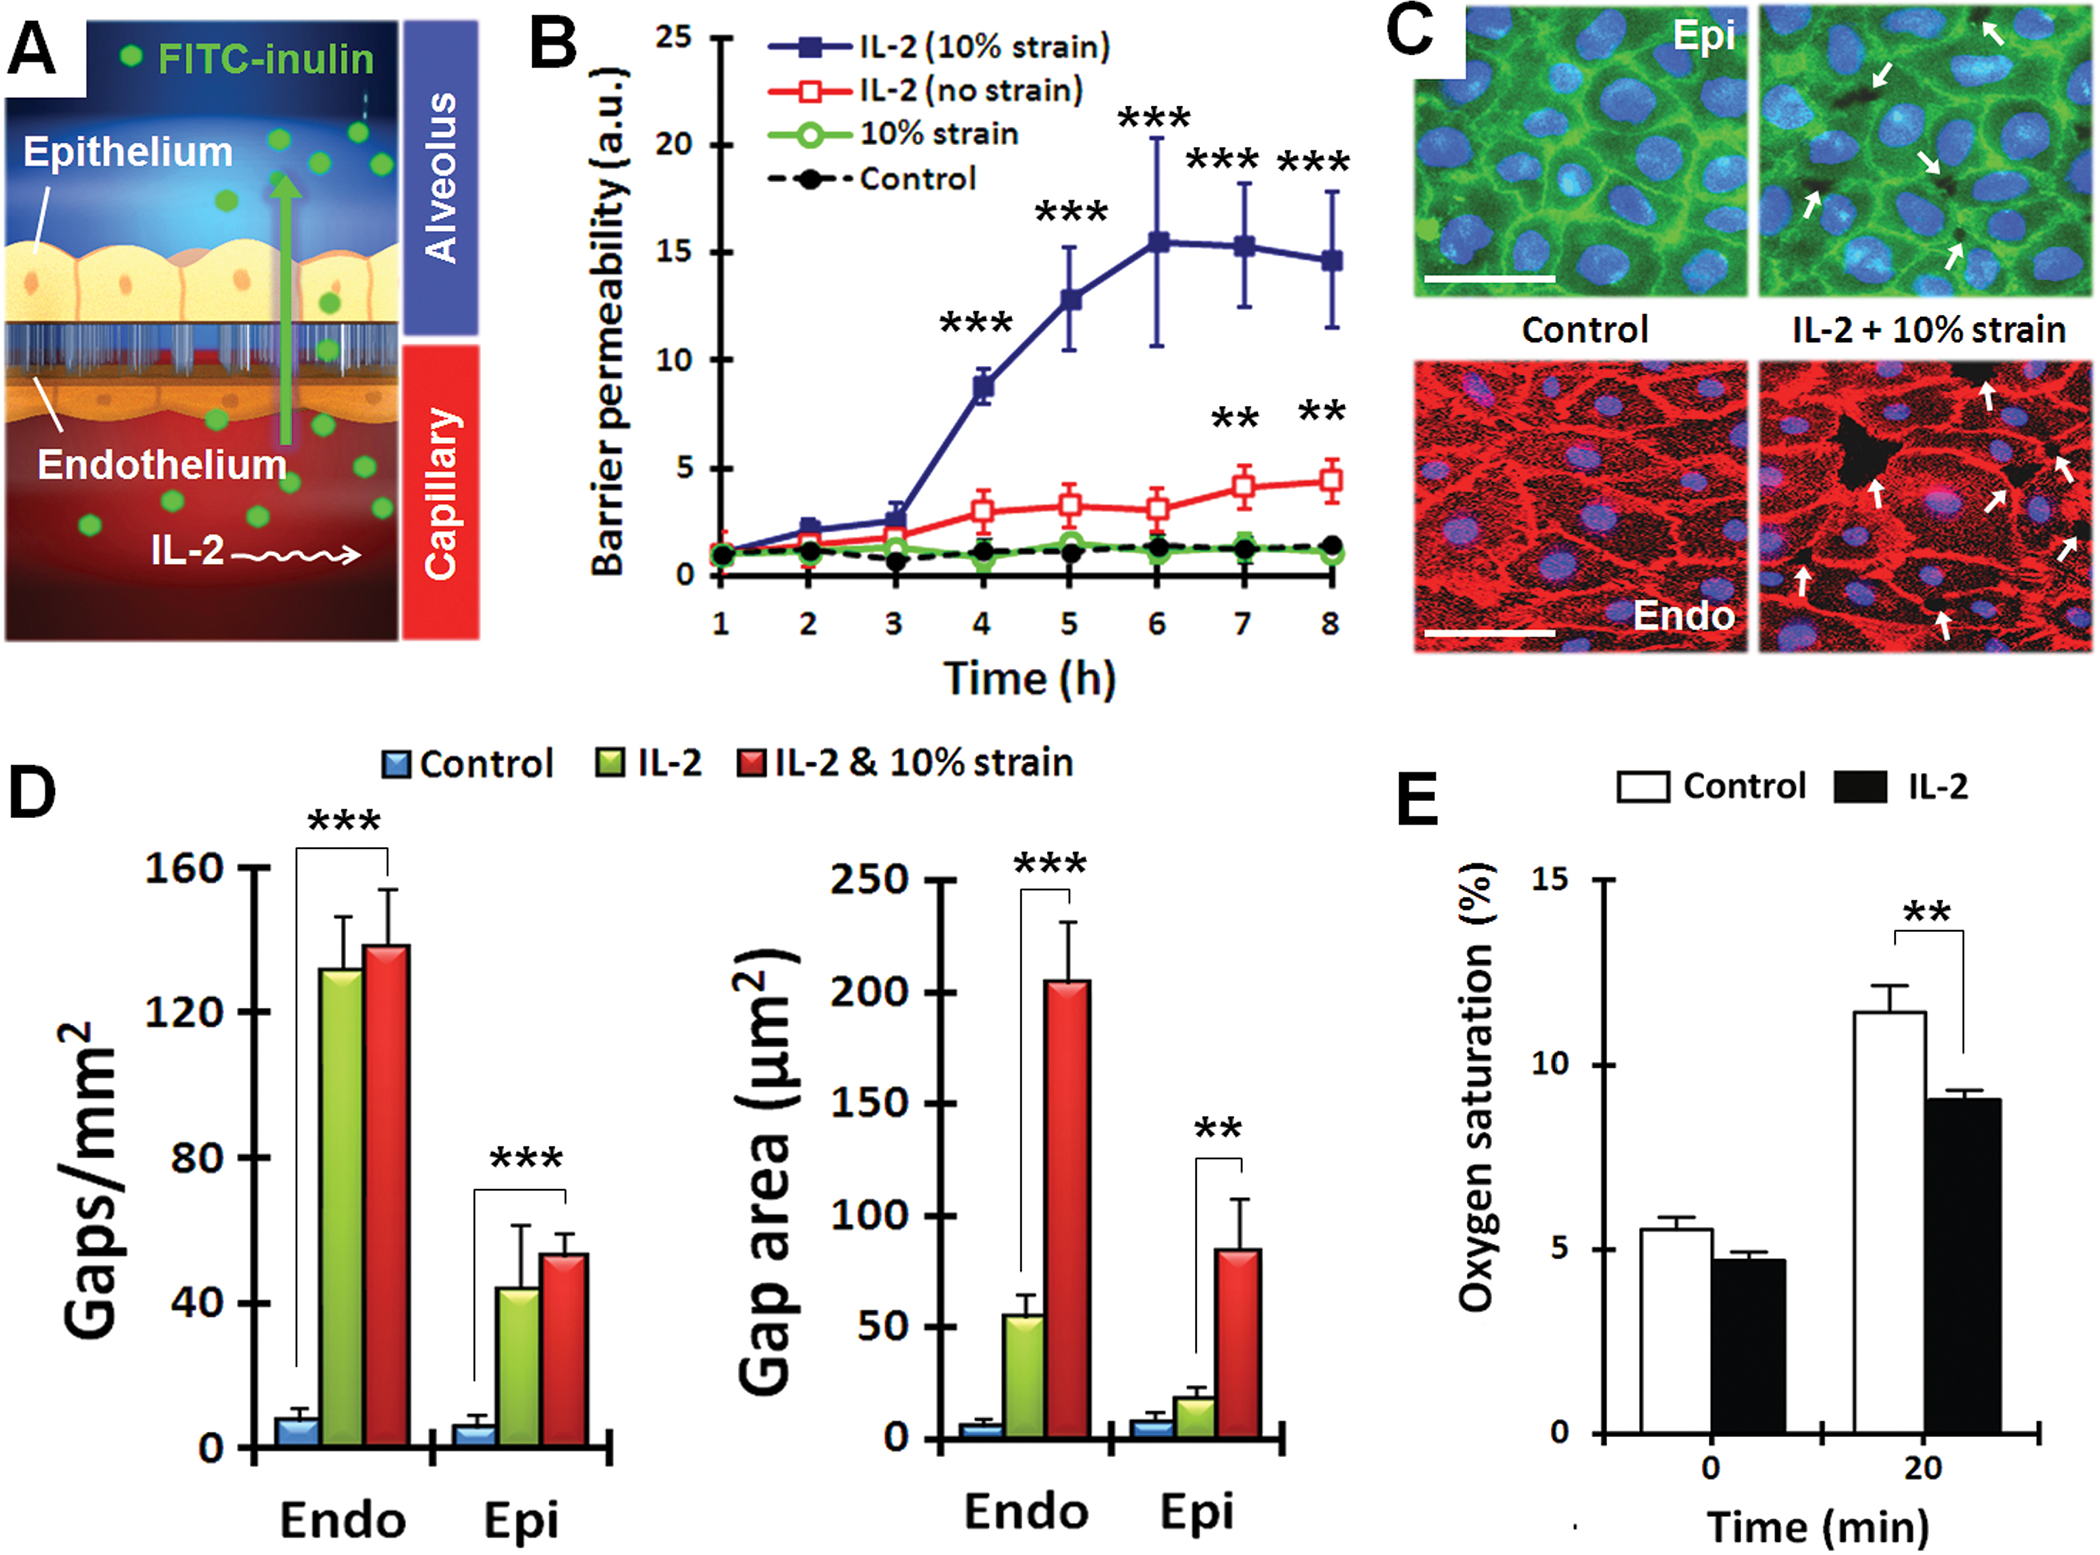
Fig. 2.

Quantitative analysis of pulmonary edema progression on-chip. (A) Pathological alterations of barrier function were quantified by measuring alveolar-capillary permeability to FITC-inulin (green) introduced into the microvascular channel containing IL-2. (B) Barrier permeability in response to IL-2, with and without cyclical strain. Data are means ± SEM (n = 3) and were normalized to the mean at time 0 (C) Immunostaining of epithelial occludin (green) and endothelial VE-cadherin (red) after 3 days of cyclic stretch with 10% strain without IL-2 (control) or with IL-2. White arrows indicate intercellular gaps; blue, nuclear staining. Scale bars, 30 μm. (D) Compromised barrier integrity due to IL-2 and mechanical strain assessed by quantifying the number and size of intercellular gaps. Data are means ± SEM (n = 3). (E) Quantification of O2 uptake from air in the epithelial channel by deoxygenated medium flowing through vascular channel in control and IL-2-treated lung chips. Data are means ± SEM (n = 3). For (B, D, and E), **P < 0.01, ***P < 0.001, ANOVA followed by post hoc Tukey’s multiple comparison test.
