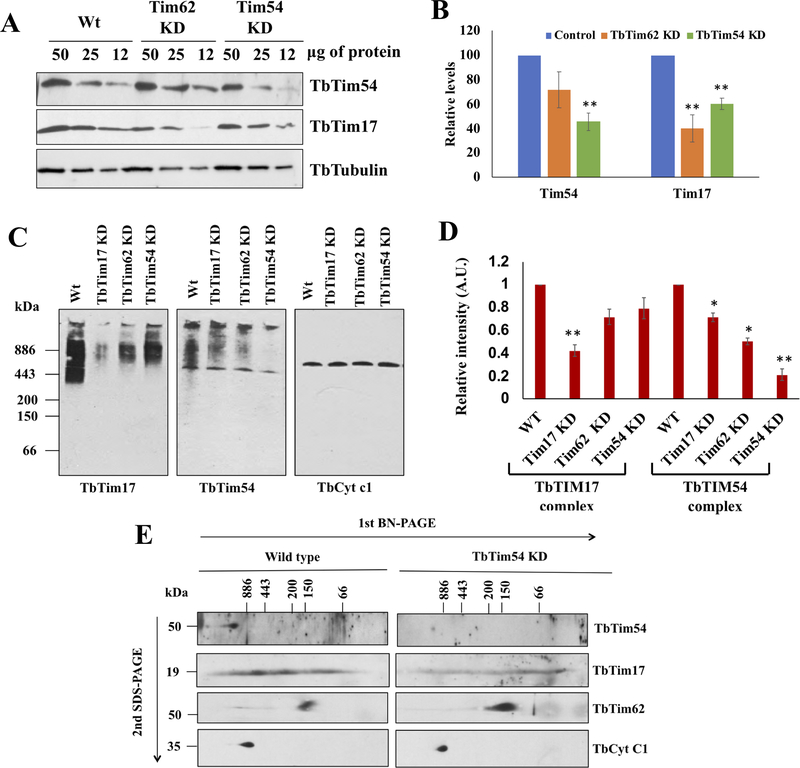
Figure 2|. Effect of TbTim54 KD on the levels of mitochondrial proteins and protein complexes.
(A) Immunoblot analysis of the serially diluted mitochondrial proteins (50, 25 and 12 μg) from the wild type (Wt), TbTim62-KD, and TbTim54-KD T. brucei using antibodies for TbTim54 and TbTim17. (B) Densitometric analysis of the TbTim54 and TbTim17 protein bands. Their corresponding tubulin bands were used for normalization. Values shown are mean ± SEM from triplicate samples. ** P < 0.01, t-test. (C) Analysis of mitochondrial protein complexes containing TbTim17 and TbTim54. Mitochondria were isolated from wild type, TbTim17-KD, TbTim62-KD, and TbTim54-KD T. brucei cells four days post induction of RNAi with doxycycline. Mitochondria samples (100 μg) were solubilized with digitonin (1.0%). The solubilized supernatant was clarified by centrifugation at 100,000 × g and analyzed by BN-PAGE. Protein complexes were detected by immunoblotting using antibodies for TbTim17, TbTim54, and TbCyt c1. Molecular weight marker proteins apoferritin dimer (886 kDa), apoferritin monomer (443 kDa), β-amylase (200 kDa), alcohol dehydrogenase (150 kDa), and bovine serum albumin (66 kDa) were run on the gel and visualized by Coomassie Blue staining. Positions of the marker proteins are shown. (D) Intensities of the protein bands for TbTim17 and TbTim54 complexes were quantitated by densitometric analysis using Image J and normalized to the corresponding band intensities for the TbCyt c1 complex. Values shown are mean ± SEM from triplicate samples. ** P < 0.01, * < 0.05, t-test. (E) Gel strips from the first dimension BN-PAGE were excised and run on a second dimension SDS-PAGE. Proteins were transferred to nitrocellulose membranes and probed with the indicated antibodies.

