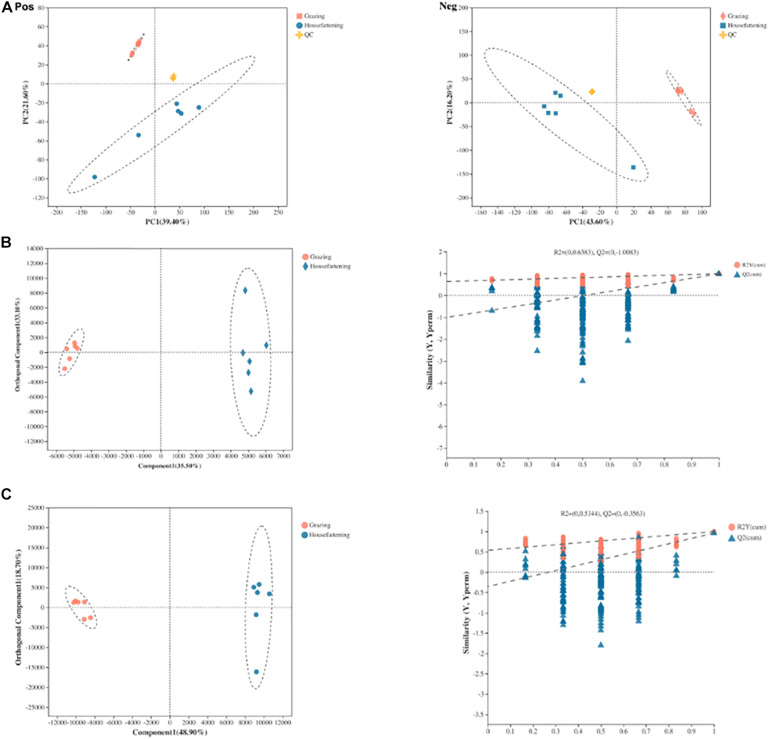
FIGURE 5.
Principal component analysis (PCA) score plots of metabolic profiling in positive (Pos) and negative (Neg) ion mode (A). OPLS-DA models of positive (B) and negative (C) mode ionization. Different colors represent different groups; pink, grazing group; blue, house fattening group; yellow, QC group.

