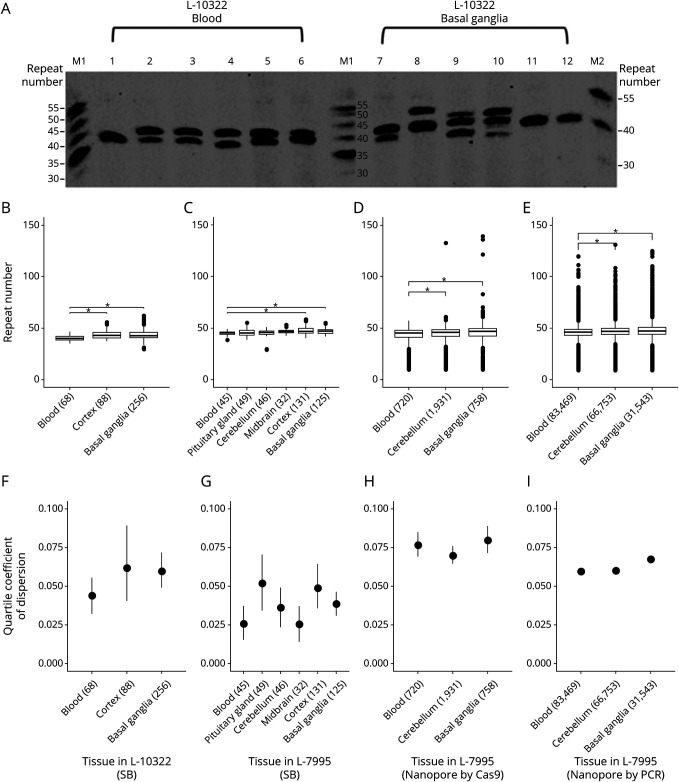
Figure 1. Number and Instability of (CCCTCT)n Repeats in Blood and Different Brain Regions.
(A) Representative Southern blot image illustrating repeat number (RN) heterogeneity in the blood (lanes 1–6) and basal ganglia (lanes 7–12) of L-10322. Each lane represents 1 small-pool PCR reaction using DNA from the corresponding tissue as template. Custom-made size markers in lanes M1 and M2 show the sizes of alleles in RNs. Boxplots showing median RNs for (B) L-10322 and (C) L-7995 measured using Southern blotting (SB) and (D) L-7995 with Oxford Nanopore long-read sequencing after Cas9 enrichment (E) L-7995 measured with PCR amplification of the SVA and subsequent Oxford Nanopore deep long-read sequencing. Forest plots presenting repeat instability measured as the quartile coefficient of dispersion (QCD) in (F) L-10322 and (G) L-7995 based on SB and (H) L-7995 with Nanopore sequencing with Cas9 enrichment (I) L-7995 with Nanopore sequencing of PCR product. Parentheses indicate the number of bands or alleles measured for each tissue. Asterisks indicate significant differences between samples.

