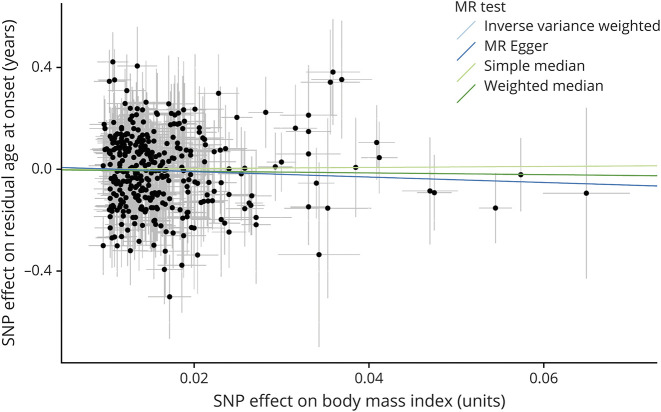
Figure 1. Scatterplot of the Effect of Each Single Genetic Instrument on BMI and Residual Age at Onset.
Each dot represents the combined effect of a single nucleotide polymorphism (SNP) on body mass index (BMI, horizontal axis) and residual age at onset in Huntington disease (vertical axis). The thin lines emanating from each dot represent the associated standard errors. Please note that all SNPs with a negative effect on BMI are shown to be positive with the sign of the effect on residual age at onset flipped. The causal association is represented by the slope of the regression lines for 4 representative mendelian randomization (MR) methods. All MR methods consistently indicated that there was not a causal effect of BMI on residual age at onset in Huntington disease.

