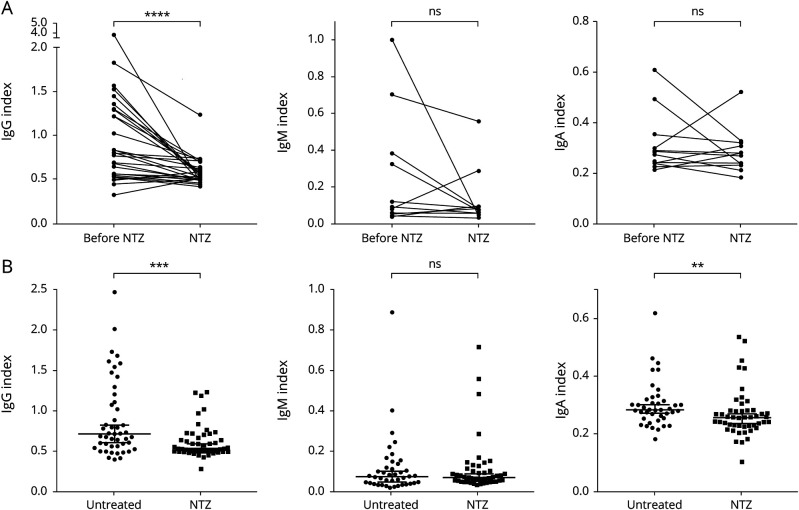
Figure 1. Isotype-Specific Effect of NTZ on Intrathecal Immunoglobulin (Ig) Production.
The Ig indices as a measure of intrathecal Ig production were calculated as described under Methods. Ig indices for IgG (left), IgM (middle), and IgA (right) are shown. (A) Longitudinal analysis: Paired data on Ig indices of patients before and during NTZ therapy were available for 26 patients for IgG, 13 patients for IgM, and 12 patients for IgA. IgG index (mean 1.0 before vs 0.6 during NTZ) was significantly reduced during NTZ therapy (p < 0.0001). Four patients with high IgM indices before NTZ showed a stronger reduction of IgM indices during NTZ treatment, but when the whole group was considered, the decrease in IgM indices (mean 0.2 before vs 0.1 during NTZ) did not reach statistical significance (p = 0.3054). IgA indices (mean before 0.3 vs 0.3 during NTZ) remained stable (p = 0.4697). Wilcoxon matched-pairs signed-rank test. (B) Cross-sectional analysis: Each dot represents 1 patient. Patient numbers: IgG index: untreated n = 47, NTZ n = 49; IgM index: untreated n = 41, NTZ n = 47; IgA index untreated n = 41, NTZ = 47. IgG and, to a lesser extent, IgA indices were lower in NTZ-treated compared with untreated MS patients (p = 0.0007 and p = 0.0076). Mann-Whitney U test. ns = non significant; NTZ = natalizumab. ** p < 0.01, *** p < 0.001, and **** p < 0.0001.

