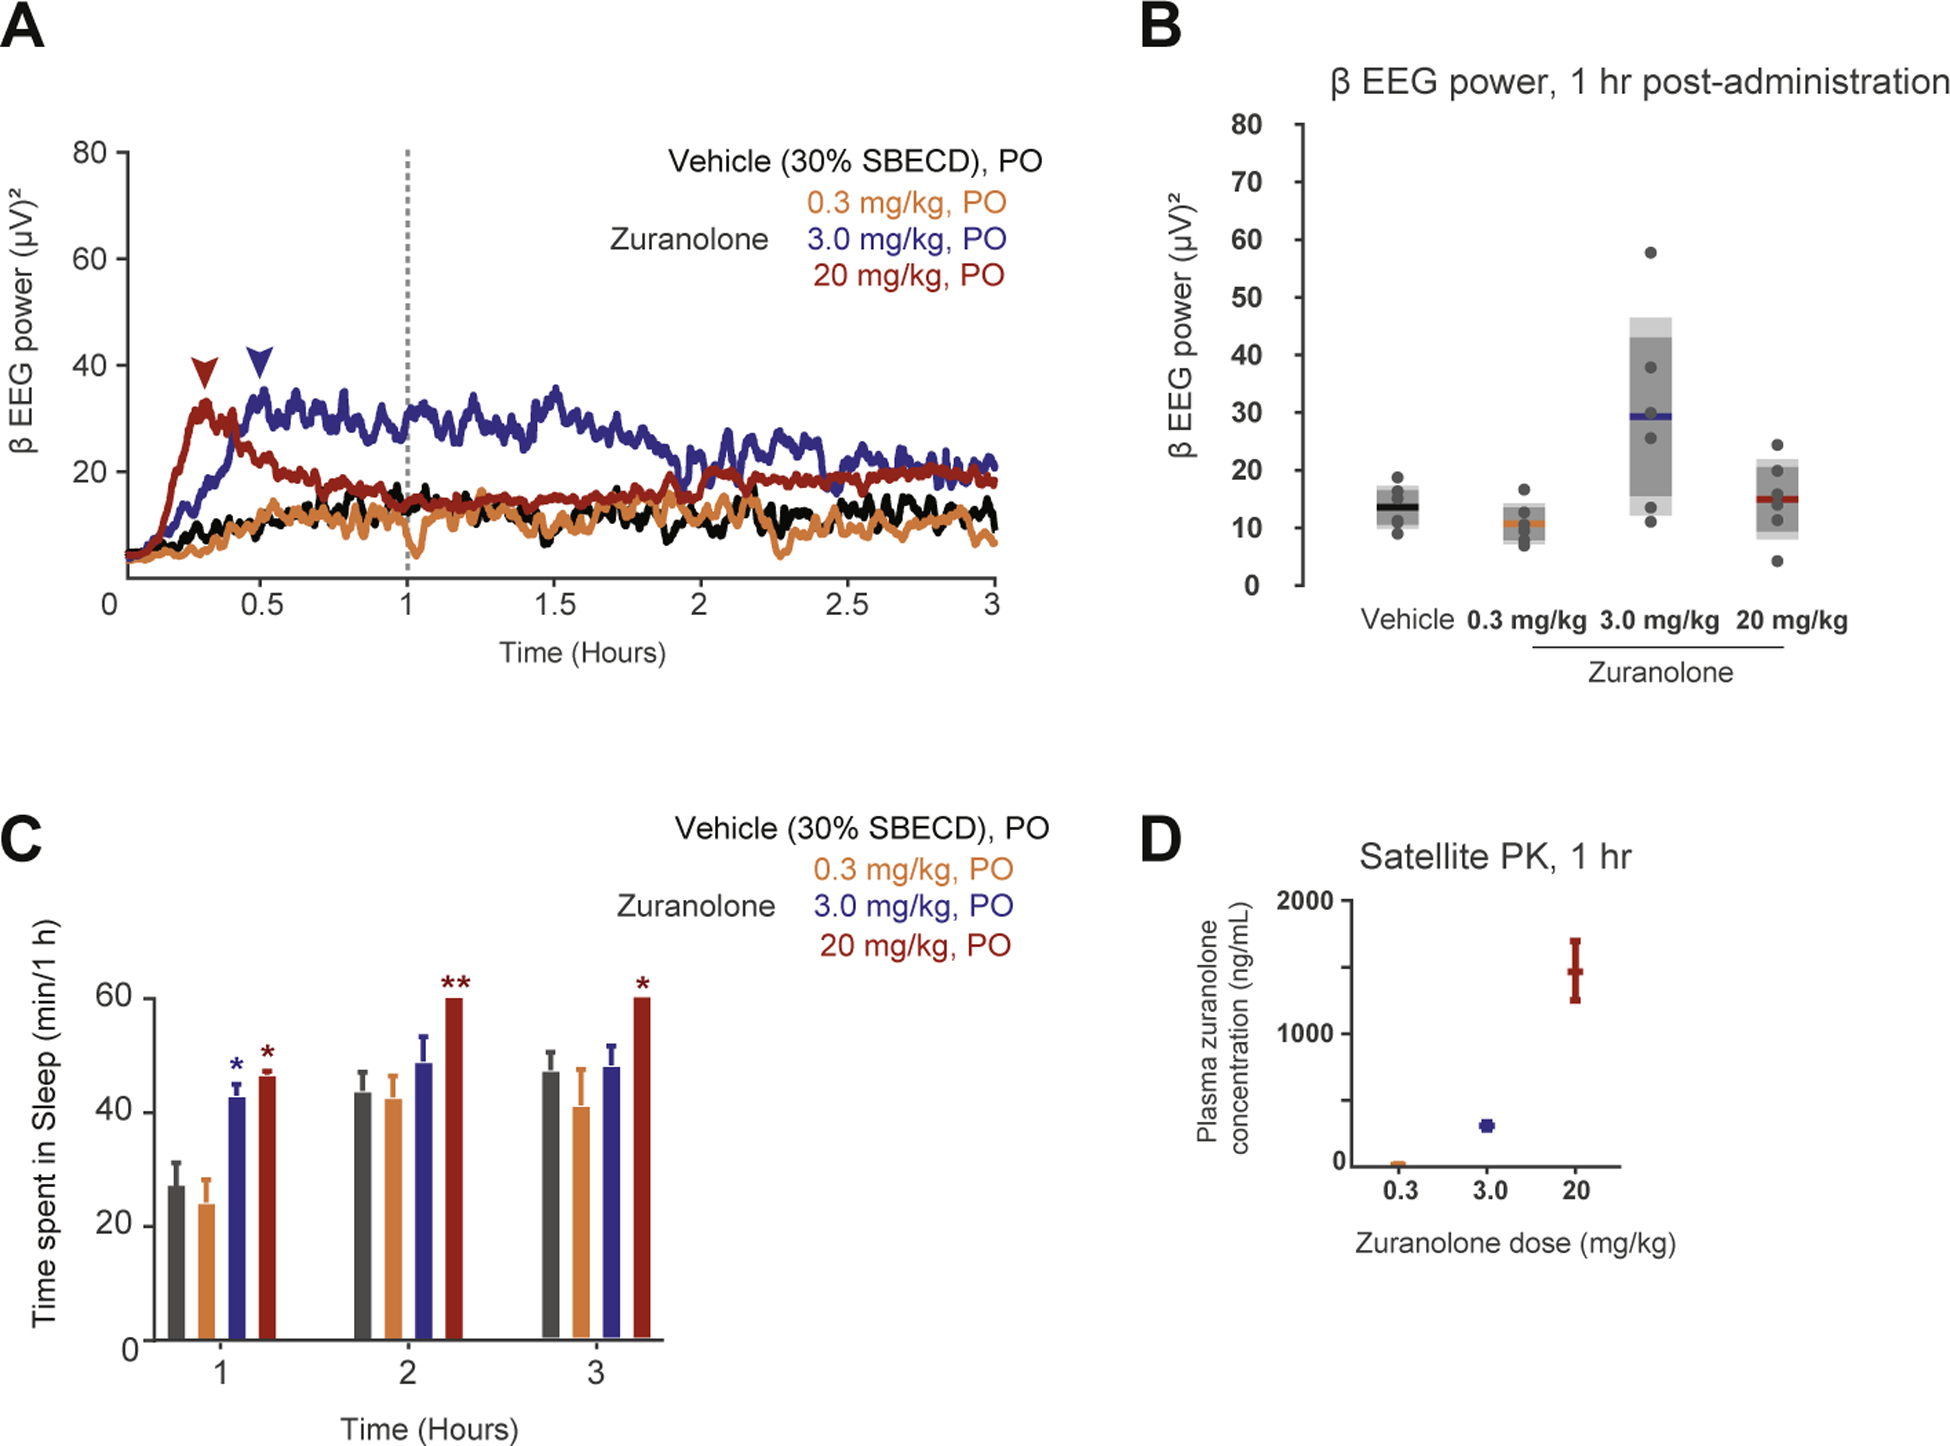
Fig. 6. Zuranolone elicits changes in β-band EEG power in rat.

A. Averaged β-band EEG power plotted across time (post-administration) in response to vehicle, and 0.3, 3, and 20 mg/kg zuranolone in rat. Arrows indicate peak for the 3 and 20 mg/kg dose groups. Dotted line indicates 1 h time point. B. Box- and-whisker plot summarizing β-band EEG power at 1 h across distinct zuranolone concentrations. C. Cumulative time (min) spent in sleep during each hour. D. Plasma zuranolone concentrations were 22, 301, and 1466 ng/mL at 60 min post dosing for 0.3, 3.0, and 20 mg/kg zuranolone, respectively from rats designated for pharmacokinetic analysis.
