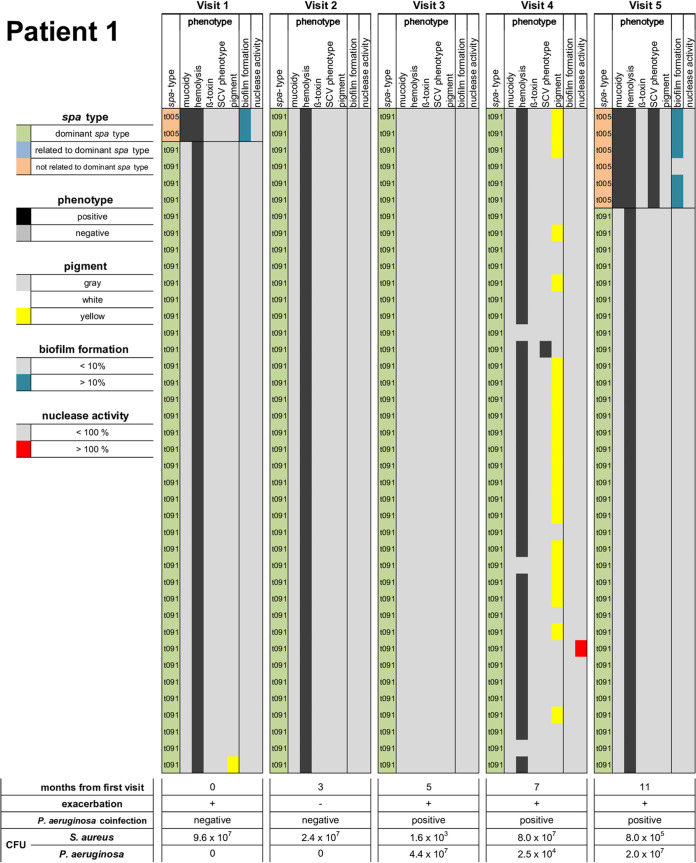
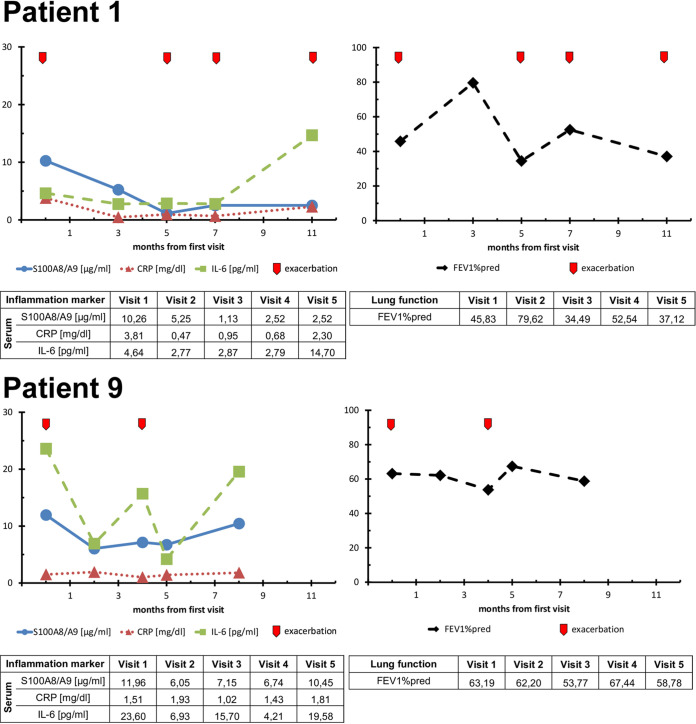
FIG 4.
Heatmaps of S. aureus isolates of patients 1 and 9 with inflammatory and lung function data of every visit. The heatmaps illustrate all data for 40 S. aureus isolates collected during every visit in terms of spa type (dominant spa type/related to the dominant spa type/not related), phenotype (PT) (mucoidy, hemolysis, β-toxin, SCV phenotype [all positive/negative], pigment [gray/white/yellow] as well as biofilm formation [low < 10% / high > 10% of the positive control] and nuclease activity [low < 100% / high > 100% of the positive control]). Below the heatmap, data of all visits are reported for months from first visit, exacerbation, P. aeruginosa coinfection, SDI for spa type and PTs. Data for S100A8/9, CRP, IL-6, and FEV1%pred are given for every visit in a table and illustrated as a graph with visits of exacerbation marked with a red arrow.


