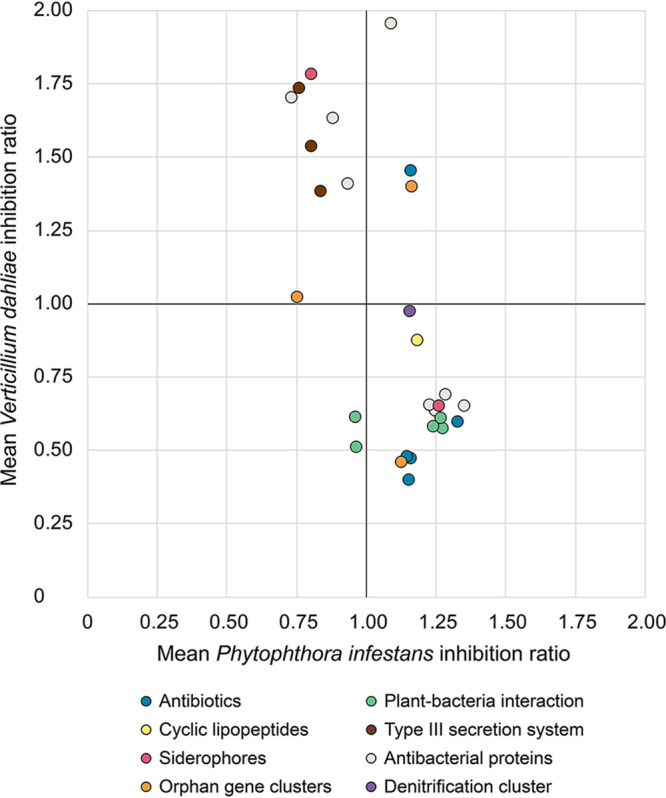
FIG 7.

Mean pathogen inhibition ratios associated with the presence or absence of phytobeneficial traits. Ratios for each phytobeneficial trait were calculated by dividing the mean inhibition achieved by Pseudomonas strains harboring it by the mean inhibition achieved by strains not harboring it. For example, if a gene/cluster has a ratio of 1.5 for a given pathogen, it means that strains harboring this gene/cluster inhibit the pathogen 50% more than strains not harboring it. Only phytobeneficial traits that significantly correlate (P < 0.05) with higher or lower pathogen inhibition and are present in five strains or more are presented.
