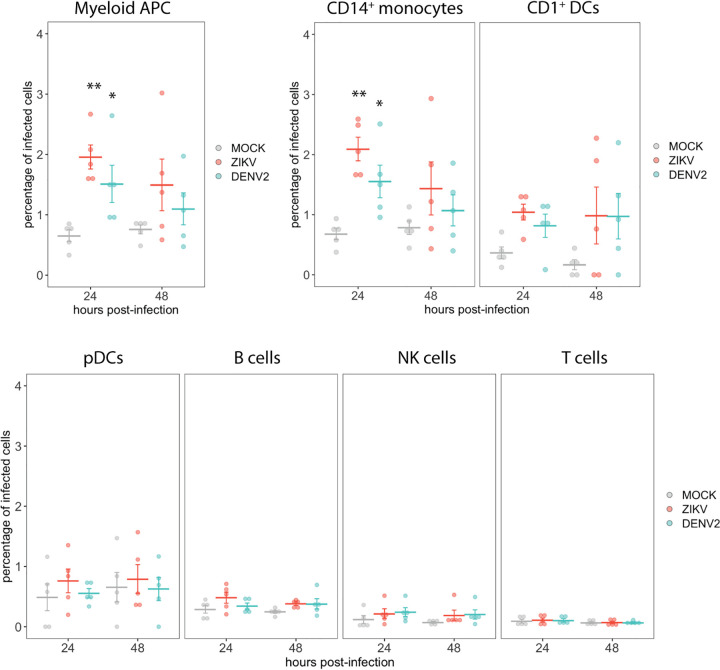
FIG 2.
CyTOF analysis of the percentage of infected cells in different cell populations after mock, ZIKV, or DENV2 exposure. The percentage of cells with expression of the viral NS3 and E (double stained with E1D8 and 4G2 antibodies) were determined within the main populations of PBMCs after mock, ZIKV, or DENV2 ex vivo exposure of PBMCs from 5 healthy donors. Means ± standard errors of the means (SEM) are indicated. **, P < 0.01; *, P < 0.05.

