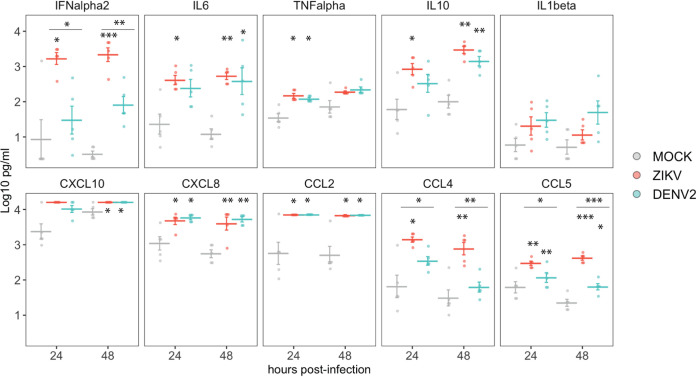
FIG 6.
Cytokine production in supernatants of mock-, ZIKV-, and DENV2-exposed PBMCs in cultures quantified by Luminex assay. Data from cells from 5 donors are shown. Means ± SEM are indicated. Stars without bars indicate statistically significant differences with mock treatment. ***, P <0.001; **, P <0.01; *, P <0.05.

