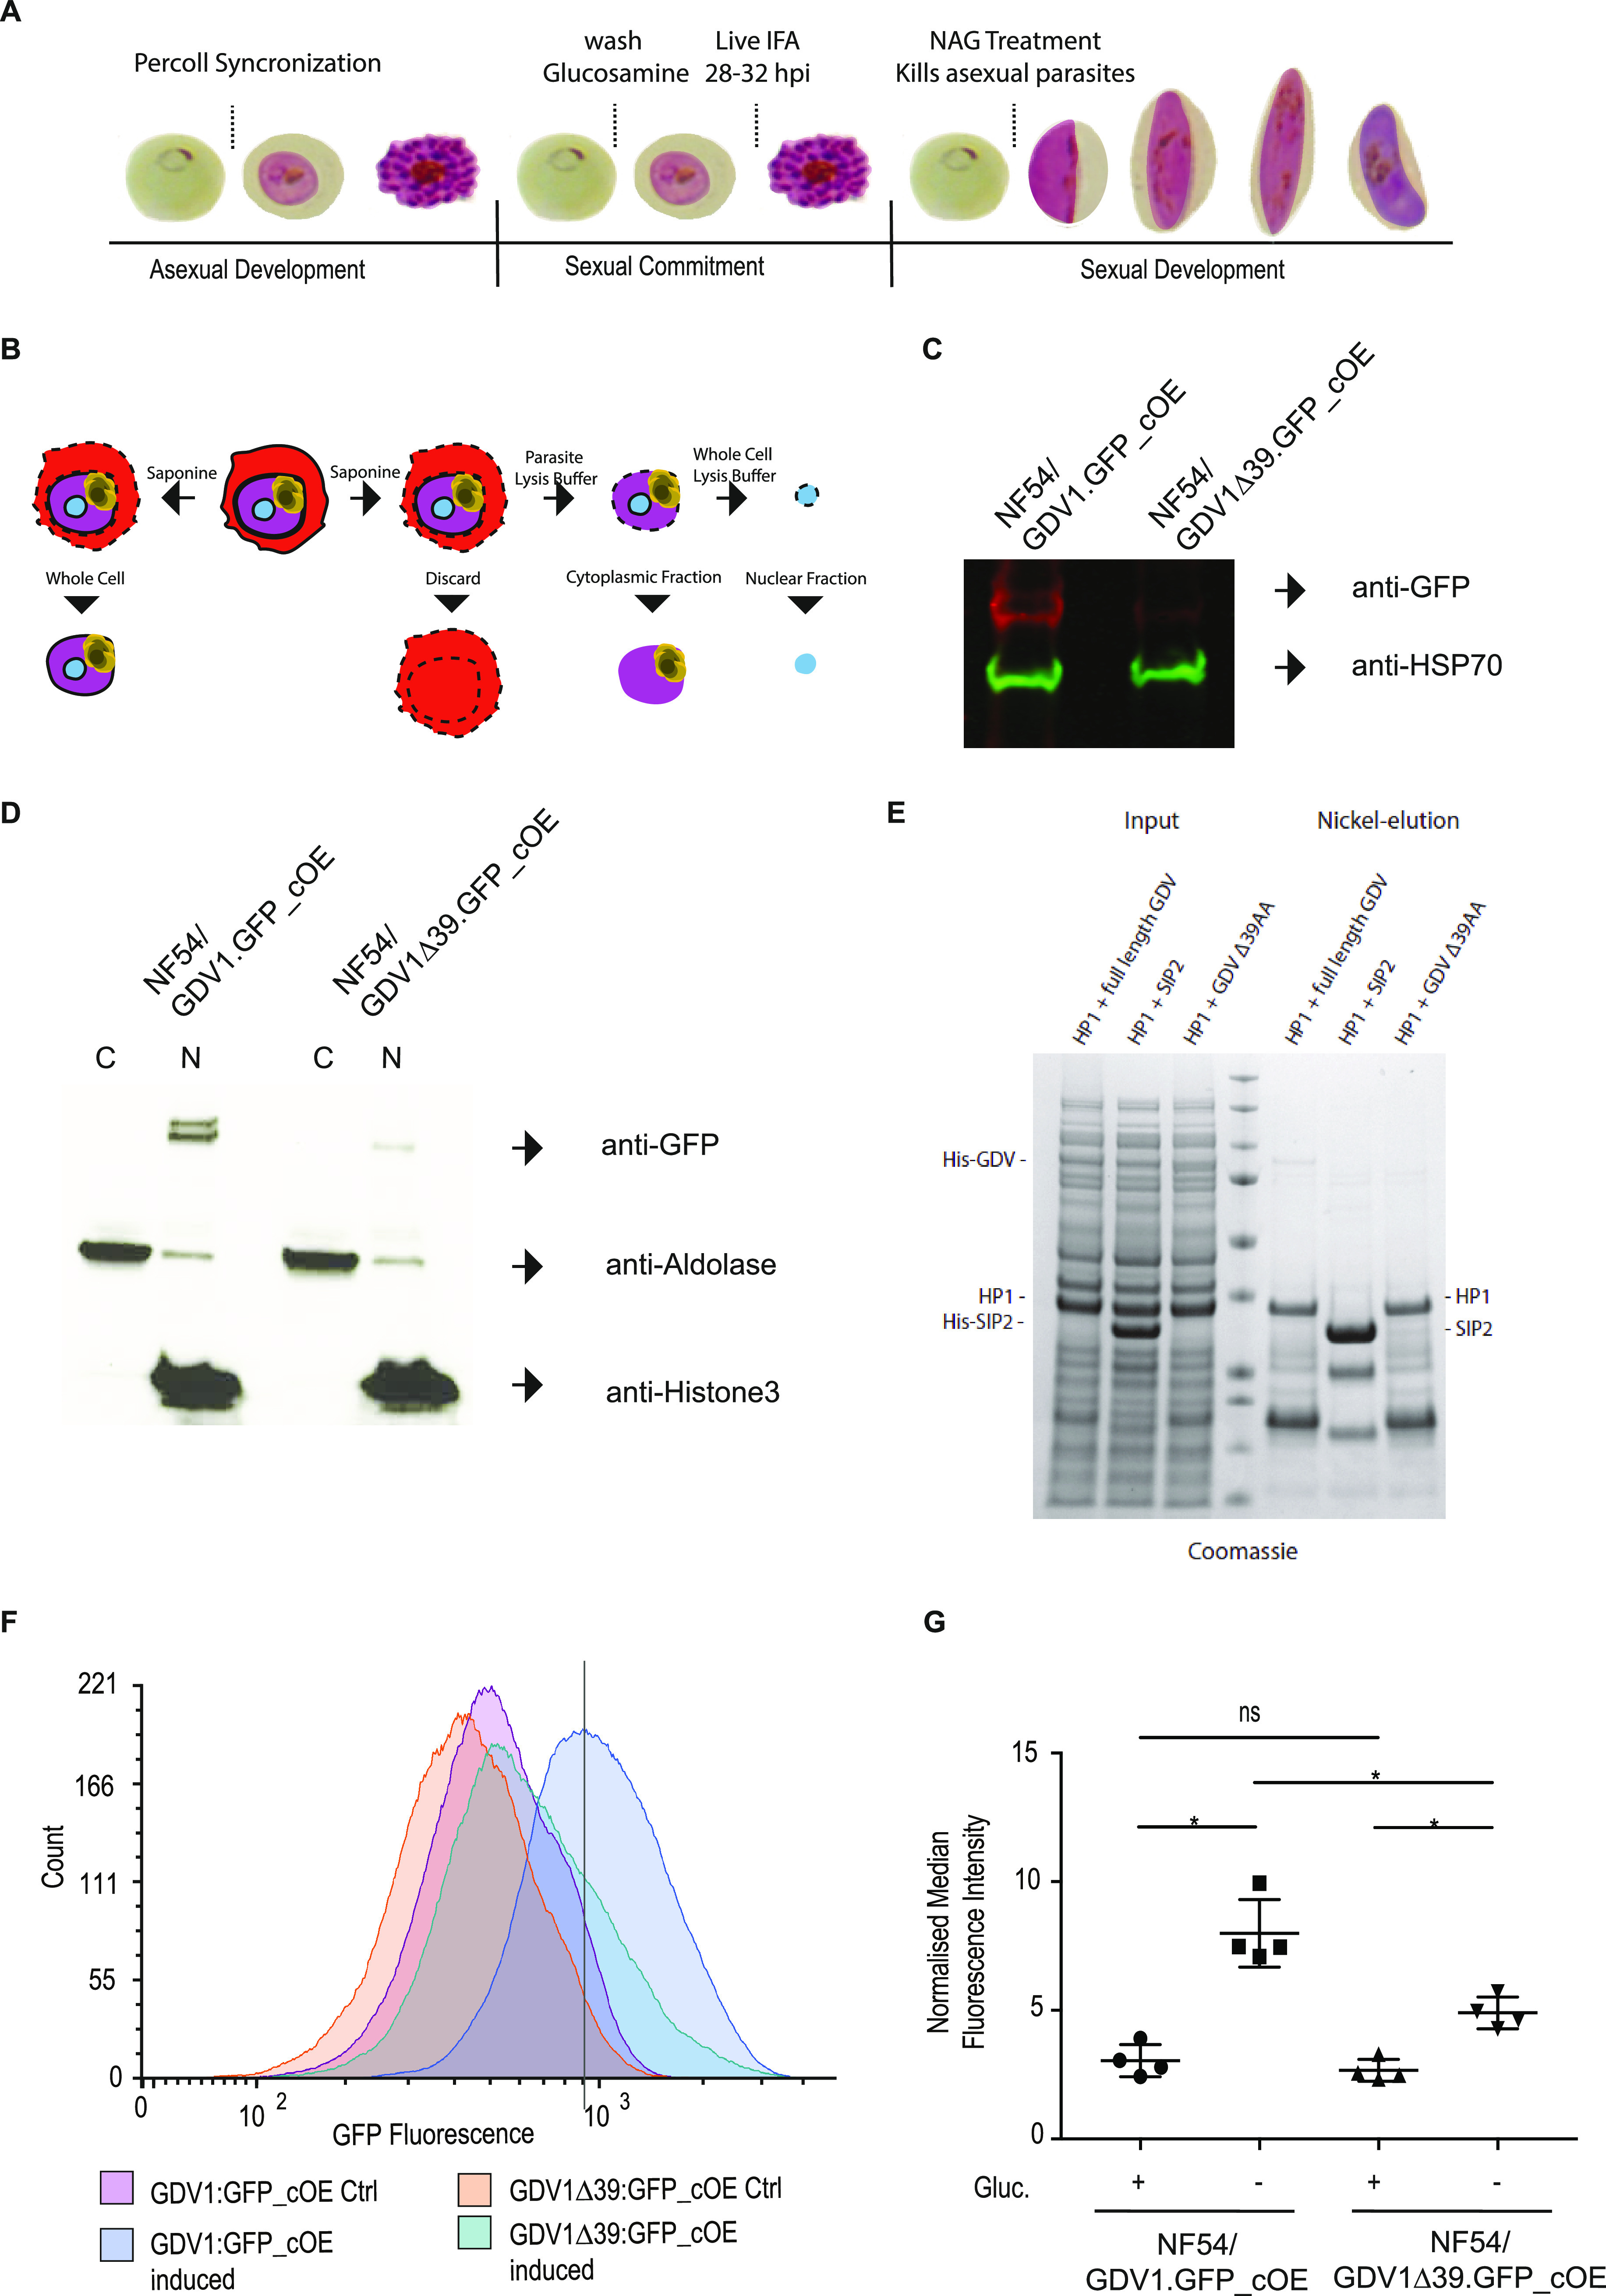
FIG 4.

GDV1Δ39 expression, localization, and interaction with HP1. (A) Representation of the protocol used to collect the samples used to characterize expression and localization of GDV1Δ39:GFP. (B) Illustration of the subcellular fractionation workflow. (C) Western blot showing the levels of GDV1:GFP expression in NF54/GDV1:GFP_cOE and GDV1Δ39:GFP in NF54/GDV1Δ39:GFP_cOE parasites grown in the absence of glucosamine (induces expression); GDV1:GFP/GDV1Δ39:GFP expression is detected using an anti-GFP antibody while anti-HSP70 antibodies have been used as controls. (D) Western blot showing GDV1:GFP expression levels in the cytoplasmic and nuclear fraction in NF54/GDV1:GFP_cOE and NF54/GDV1Δ39:GFP_cOE parasites cultured in the absence of glucosamine (induces expression). (E) Strep-HP1 copurifies with both His-GDV1 and His-GDV1Δ39 but not with the His-SIP2 control. Coomassie-stained SDS-polyacrylamide gel from pulldown experiment with His-GDV1/Strep-HP1 and His-SIP2/Strep-HP1. Lane 4: protein size standard. (F) Representative normalized flow cytometry histograms quantifying GDV1:GFP fluorescence for each parasite line. Solid line indicates the position of the peak for the wild-type NF54/GDV1:GFP_cOE line. (G) Quantification of the median fluorescence intensity of GDV1:GFP in induced or uninduced NF54/GDV1:GFP_cOE and NF54/GDV1Δ39:GFP_cOE parasite lines, normalized to uninfected parasites from each experiment, ± SD, n = 4. *, P < 0.05; ns, not significant, P ≥ 0.05; NF54/GDV1:GFP_cOE uninduced versus induced, P = 0.0227; NF54/GDV1Δ39:GFP_cOE uninduced versus induced, P = 0.0318; NF54/GDV1:GFP_cOE induced versus NF54/GDV1Δ39:GFP_cOE induced P = 0.0227; NF54/GDV1:GFP_cOE uninduced versus NF54/GDV1Δ39:GFP_cOE uninduced, P = 0.1235. Statistical analysis was performed using Holm-Sidak corrected multiple comparison analysis of variance (ANOVA).
