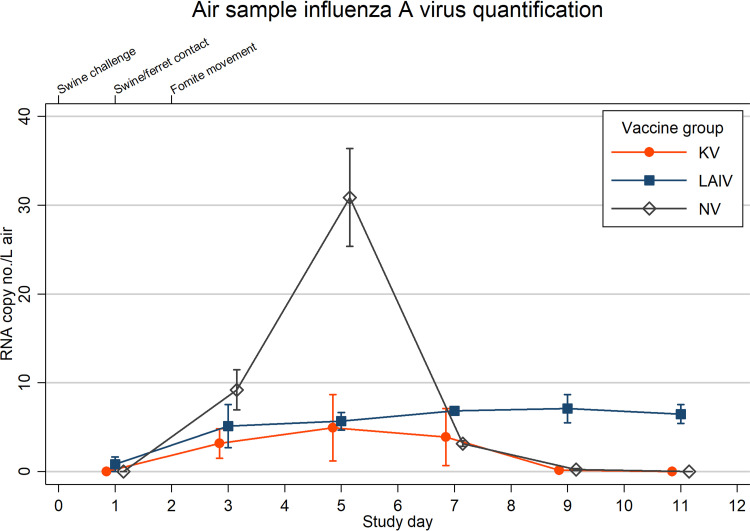
FIG 2.
Mean RNA copy number per liter of air is shown by vaccination group: live-attenuated influenza virus (LAIV), killed influenza virus (KV), or sham vaccine (NV). N = 3 air sample devices for each group time point. Spikes indicate standard errors of the means (SEM). The lower x axis indicates individual study days, and values are skewed (±0.1) to allow comparison of overlapping error bars. The upper x axis denotes timeline points of interest.

