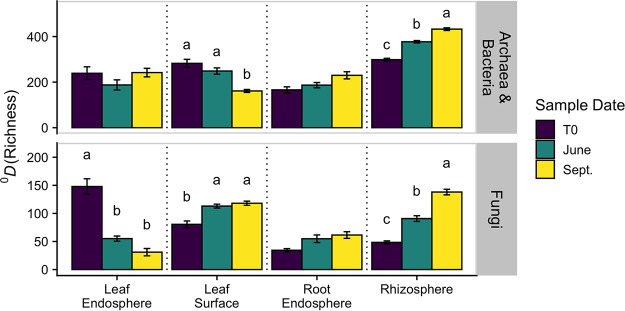
FIG 1.
Means (and standard errors) of α-diversity based on Hill numbers (40) of archaea and bacteria and fungi across plant-associated habitats and sampling dates at q = 0 (richness). Letters represent significant differences among sample dates (P < 0.05). Note the different axis scales. T0 represents samples collected directly before field propagation.

