Figure 3.

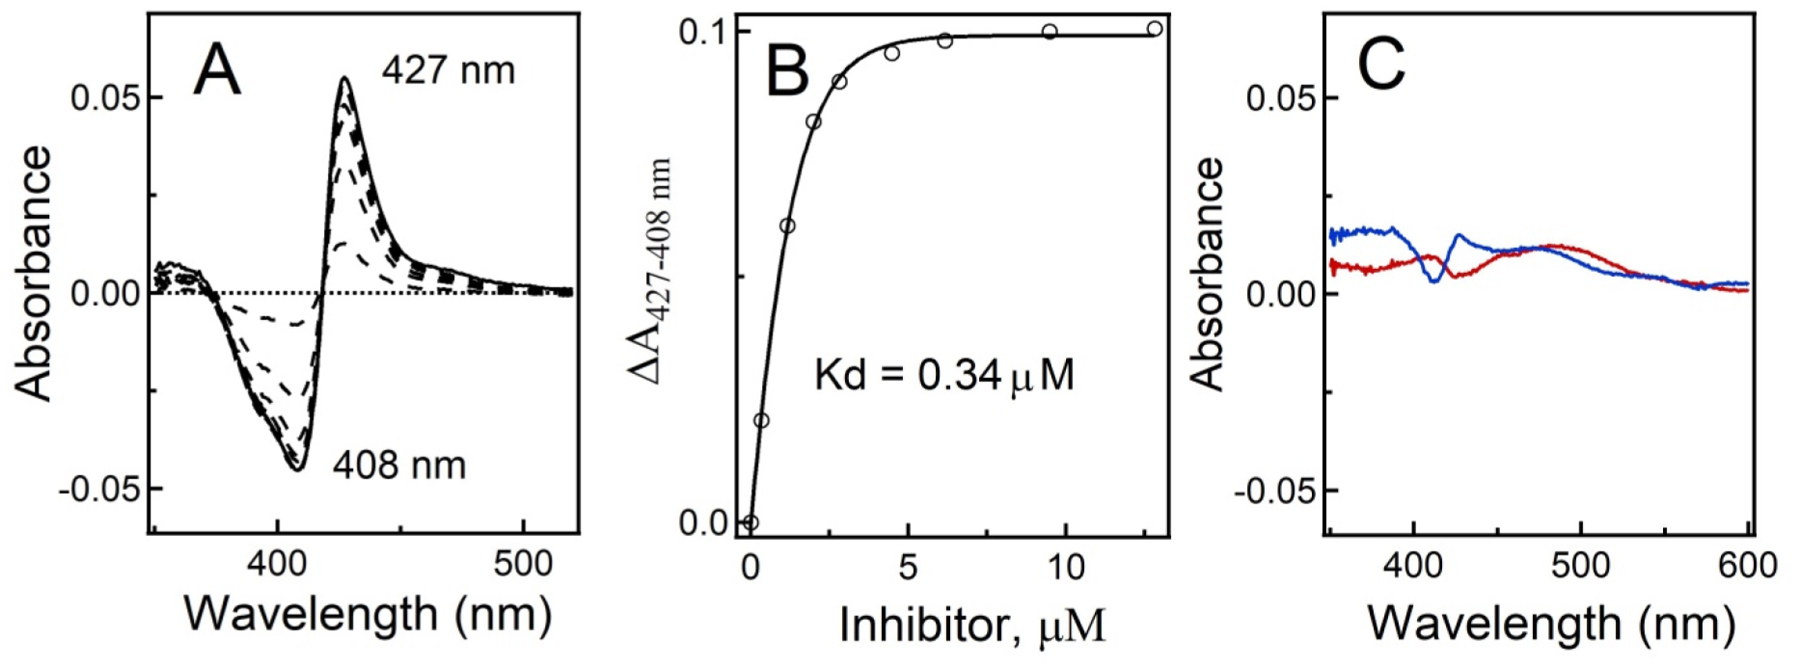
Equilibrium titration of CYP3A4 with 7 under light and dark conditions. (A) Difference spectra recorded during titration of recombinant CYP3A4 with 7 under light conditions. (B) Titration plot. The dissociation constant (Kd) was calculated by fitting the data to a hyperbolic equation: ΔA = ΔAmax[ligand]/(Kd + [ligand]), where ΔAmax is the maximal absorbance change and ΔA and [ligand] are the absorbance change and ligand concentration after each titrant addition, respectively. (C) Difference spectra recorded in control experiments, where CYP3A4 was mixed with 10 μM 7 (blue) or 10 μM [Ru(tpy)(Me2bpy)Cl]+ (red) in the dark, show the lack of spectral changes characteristic for type II N–Fe ligation.
