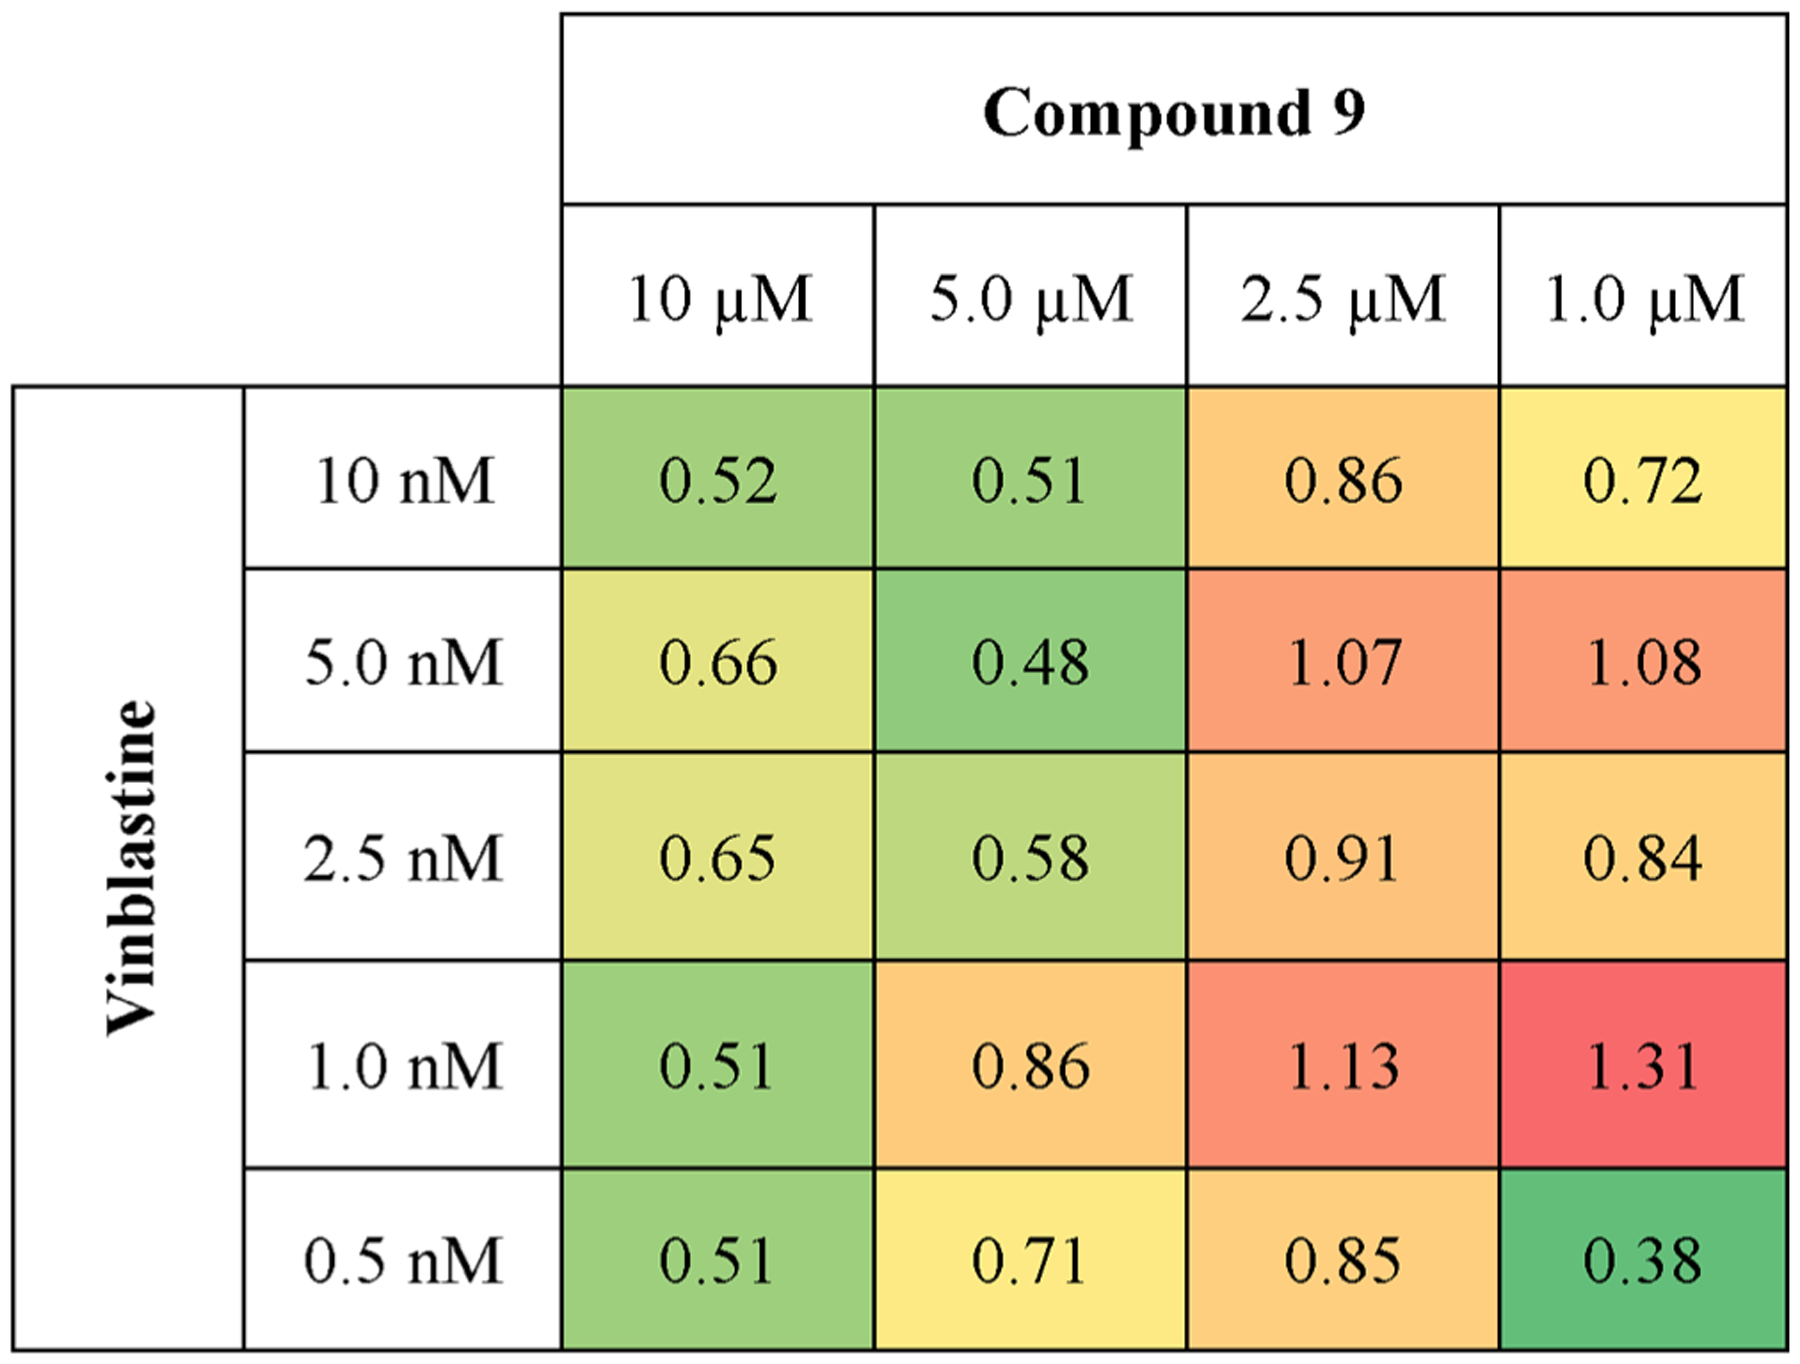
Figure 8.

Chou–Talalay combination index heat map. Chou–Talalay determination of drug synergy between 9 and vinblastine under light conditions (tirr = 20 min, λirr = 460–470 nm, 56 J/cm2). Effects on cell killing were determined by MTT 48 h after light treatment. Values shown in colored boxes denote combination indices (CI). CI > 1: antagonism. CI = 1: additive effect. CI < 1: synergy. CI values were obtained using Compusyn software.
