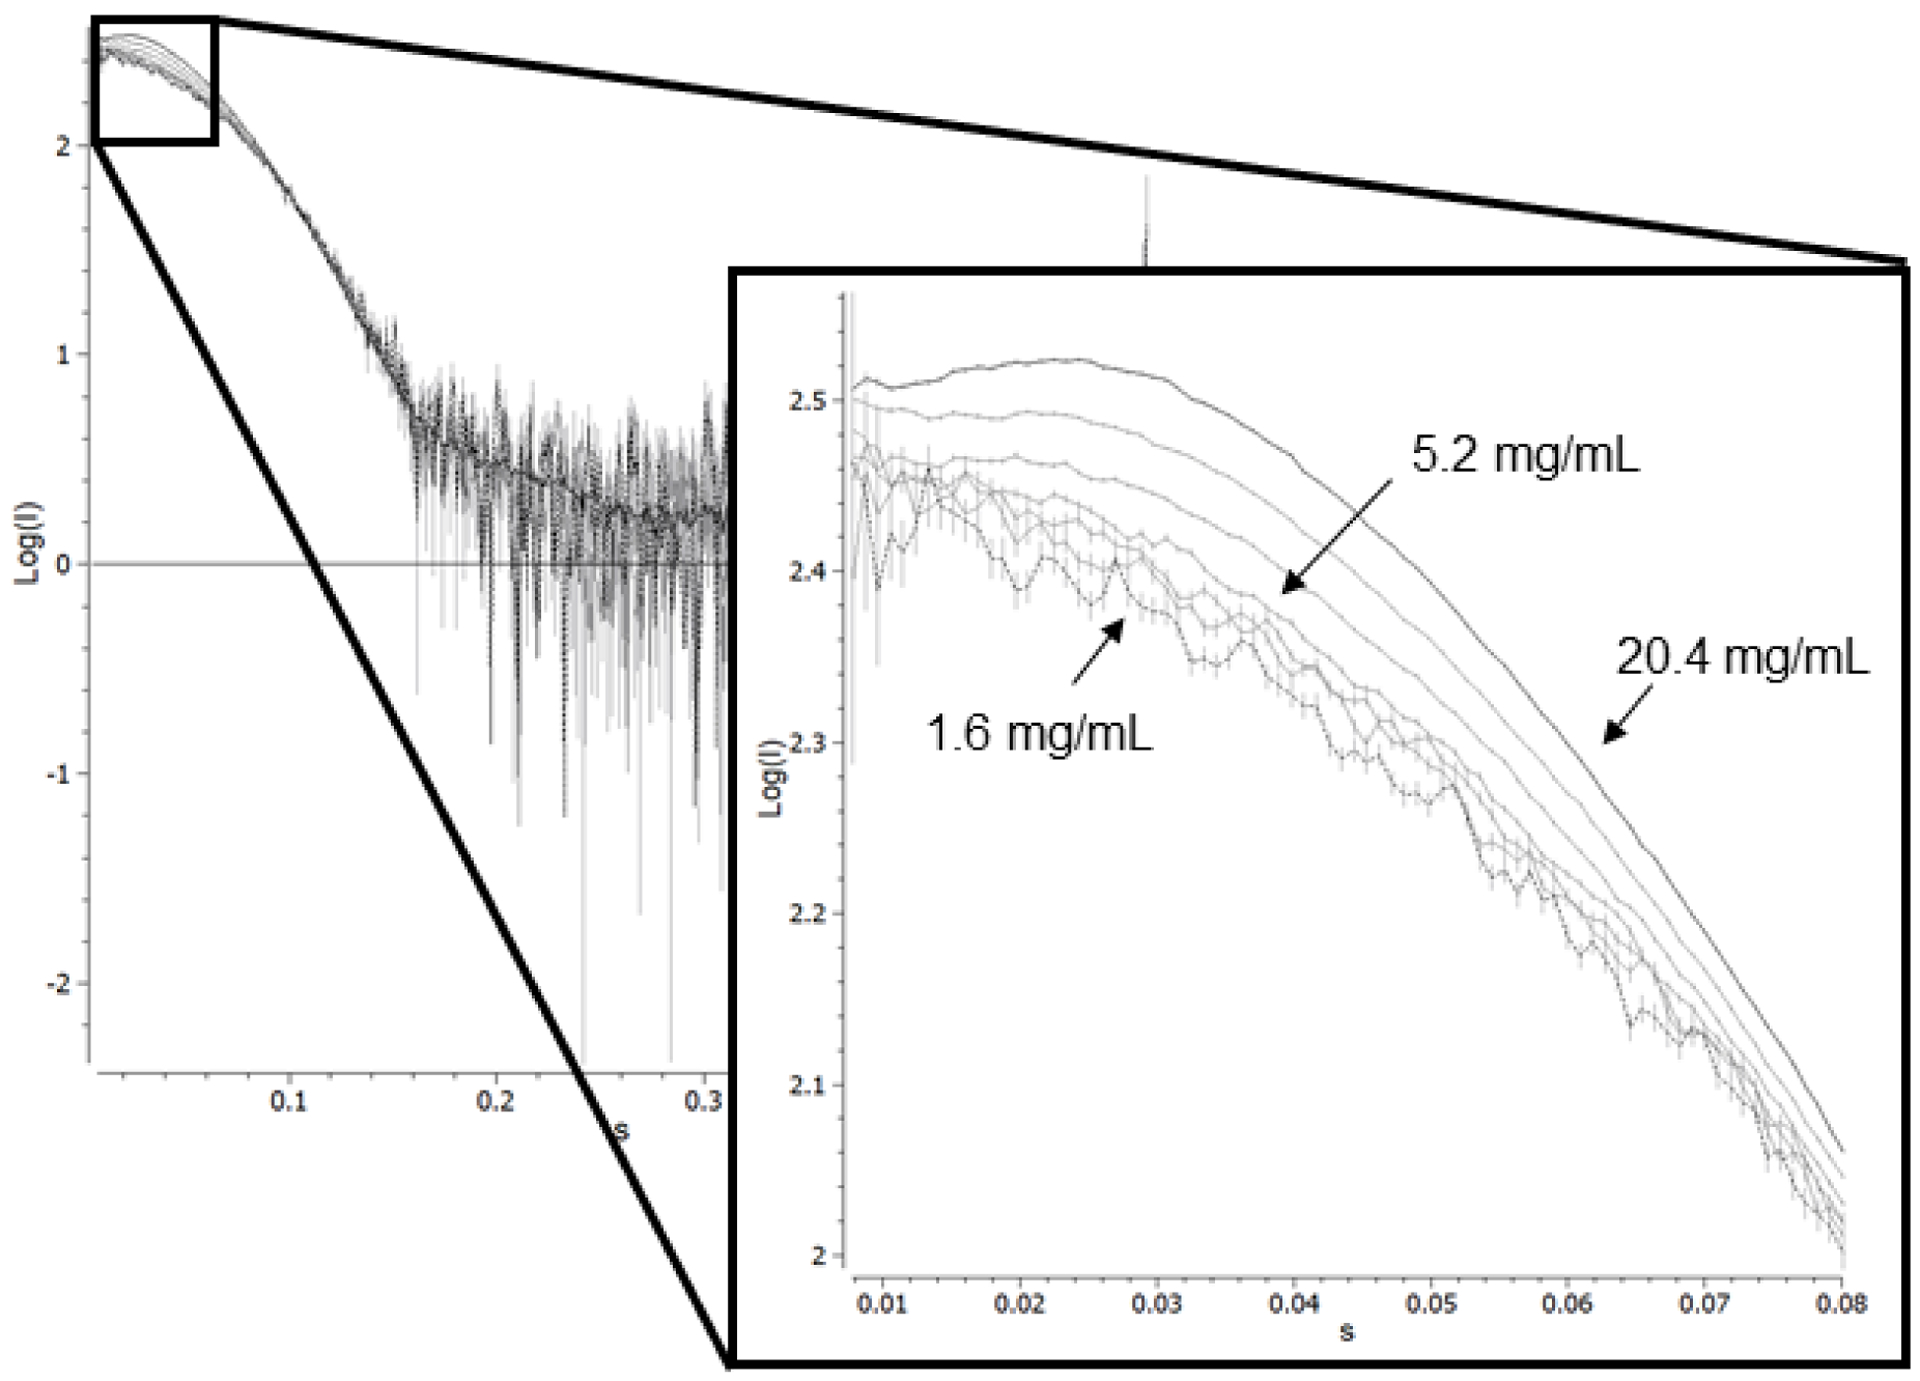
Figure 3.

Scattering curves for OxyHbIII as a function of concentration. The scattering curves were determined by serial dilution starting with approx. 20.4 mg/mL (black solid line) and ending at 1.6 mg/mL (black dashed line) protein concentration in 10 mM HEPES pH 7.0. X-ray scattering data collected at SSRL. Inset: Expansion of the low q region. At higher protein concentrations, there is a downturn in the scattering curve characteristic of inter-particle repulsion.
