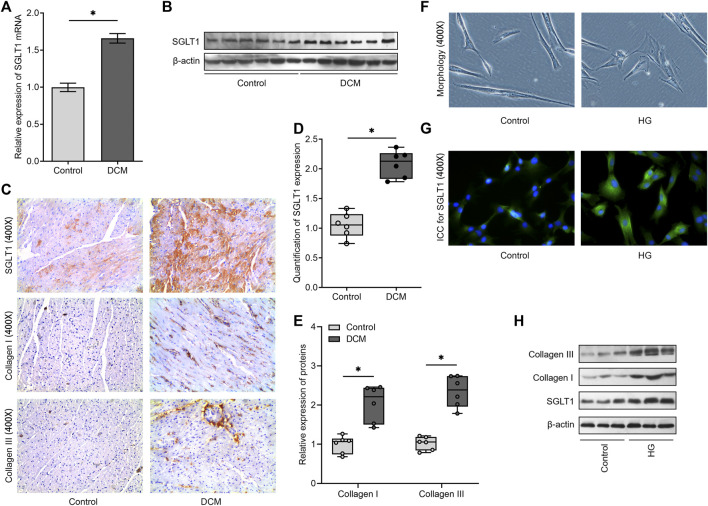
FIGURE 2.
SGLT1 is downregulated in the experimental diabetic cardiac fibrosis model and high-glucose–induced CFs. (A) The mRNA level of SGLT1 was detected using RT‐qPCR (n = 6). (B) The protein level of SGLT1 was analyzed using western blot analysis (n = 6). (C) The protein levels of SGLT1, collagen I, and collagen III were evaluated using immunohistochemical staining. Relative expression of SGLT1 (D) and collagen I and collagen III (E) was found using semiquantitative analysis based on immunohistochemistry. (F) The morphology of CFs with or without high-glucose stimulation was imaged under an optical microscope. (G) The protein level of SGLT1 was analyzed by immunofluorescent staining in high-glucose–induced CFs. (H) The protein levels of SGLT1, collagen I, and collagen III were analyzed using western blot analysis in high-glucose–induced CFs (n = 3).

