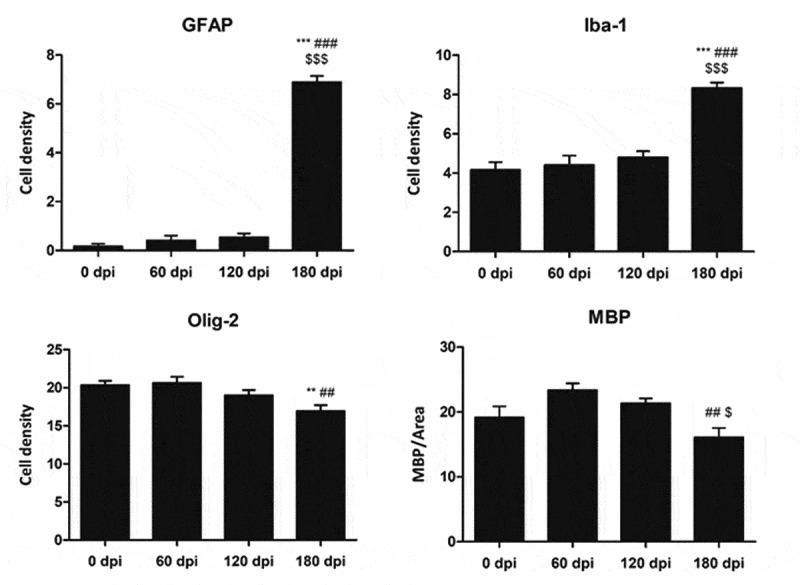
Figure 3.

Quantification of GFAP-, Iba1- and Olig2-immunoreactive cells, and MBP densitometry (arbitrary units) per area at different dpi. Differences between inoculated groups at different incubation times are set at **p < 0.01, ***p < 0.001 vs. 0 dpi; ## p < 0.01, ### p < 0.001 vs. 60 dpi; and $ p < 0.05, $$$ p < 0.001 vs. 120 dpi
