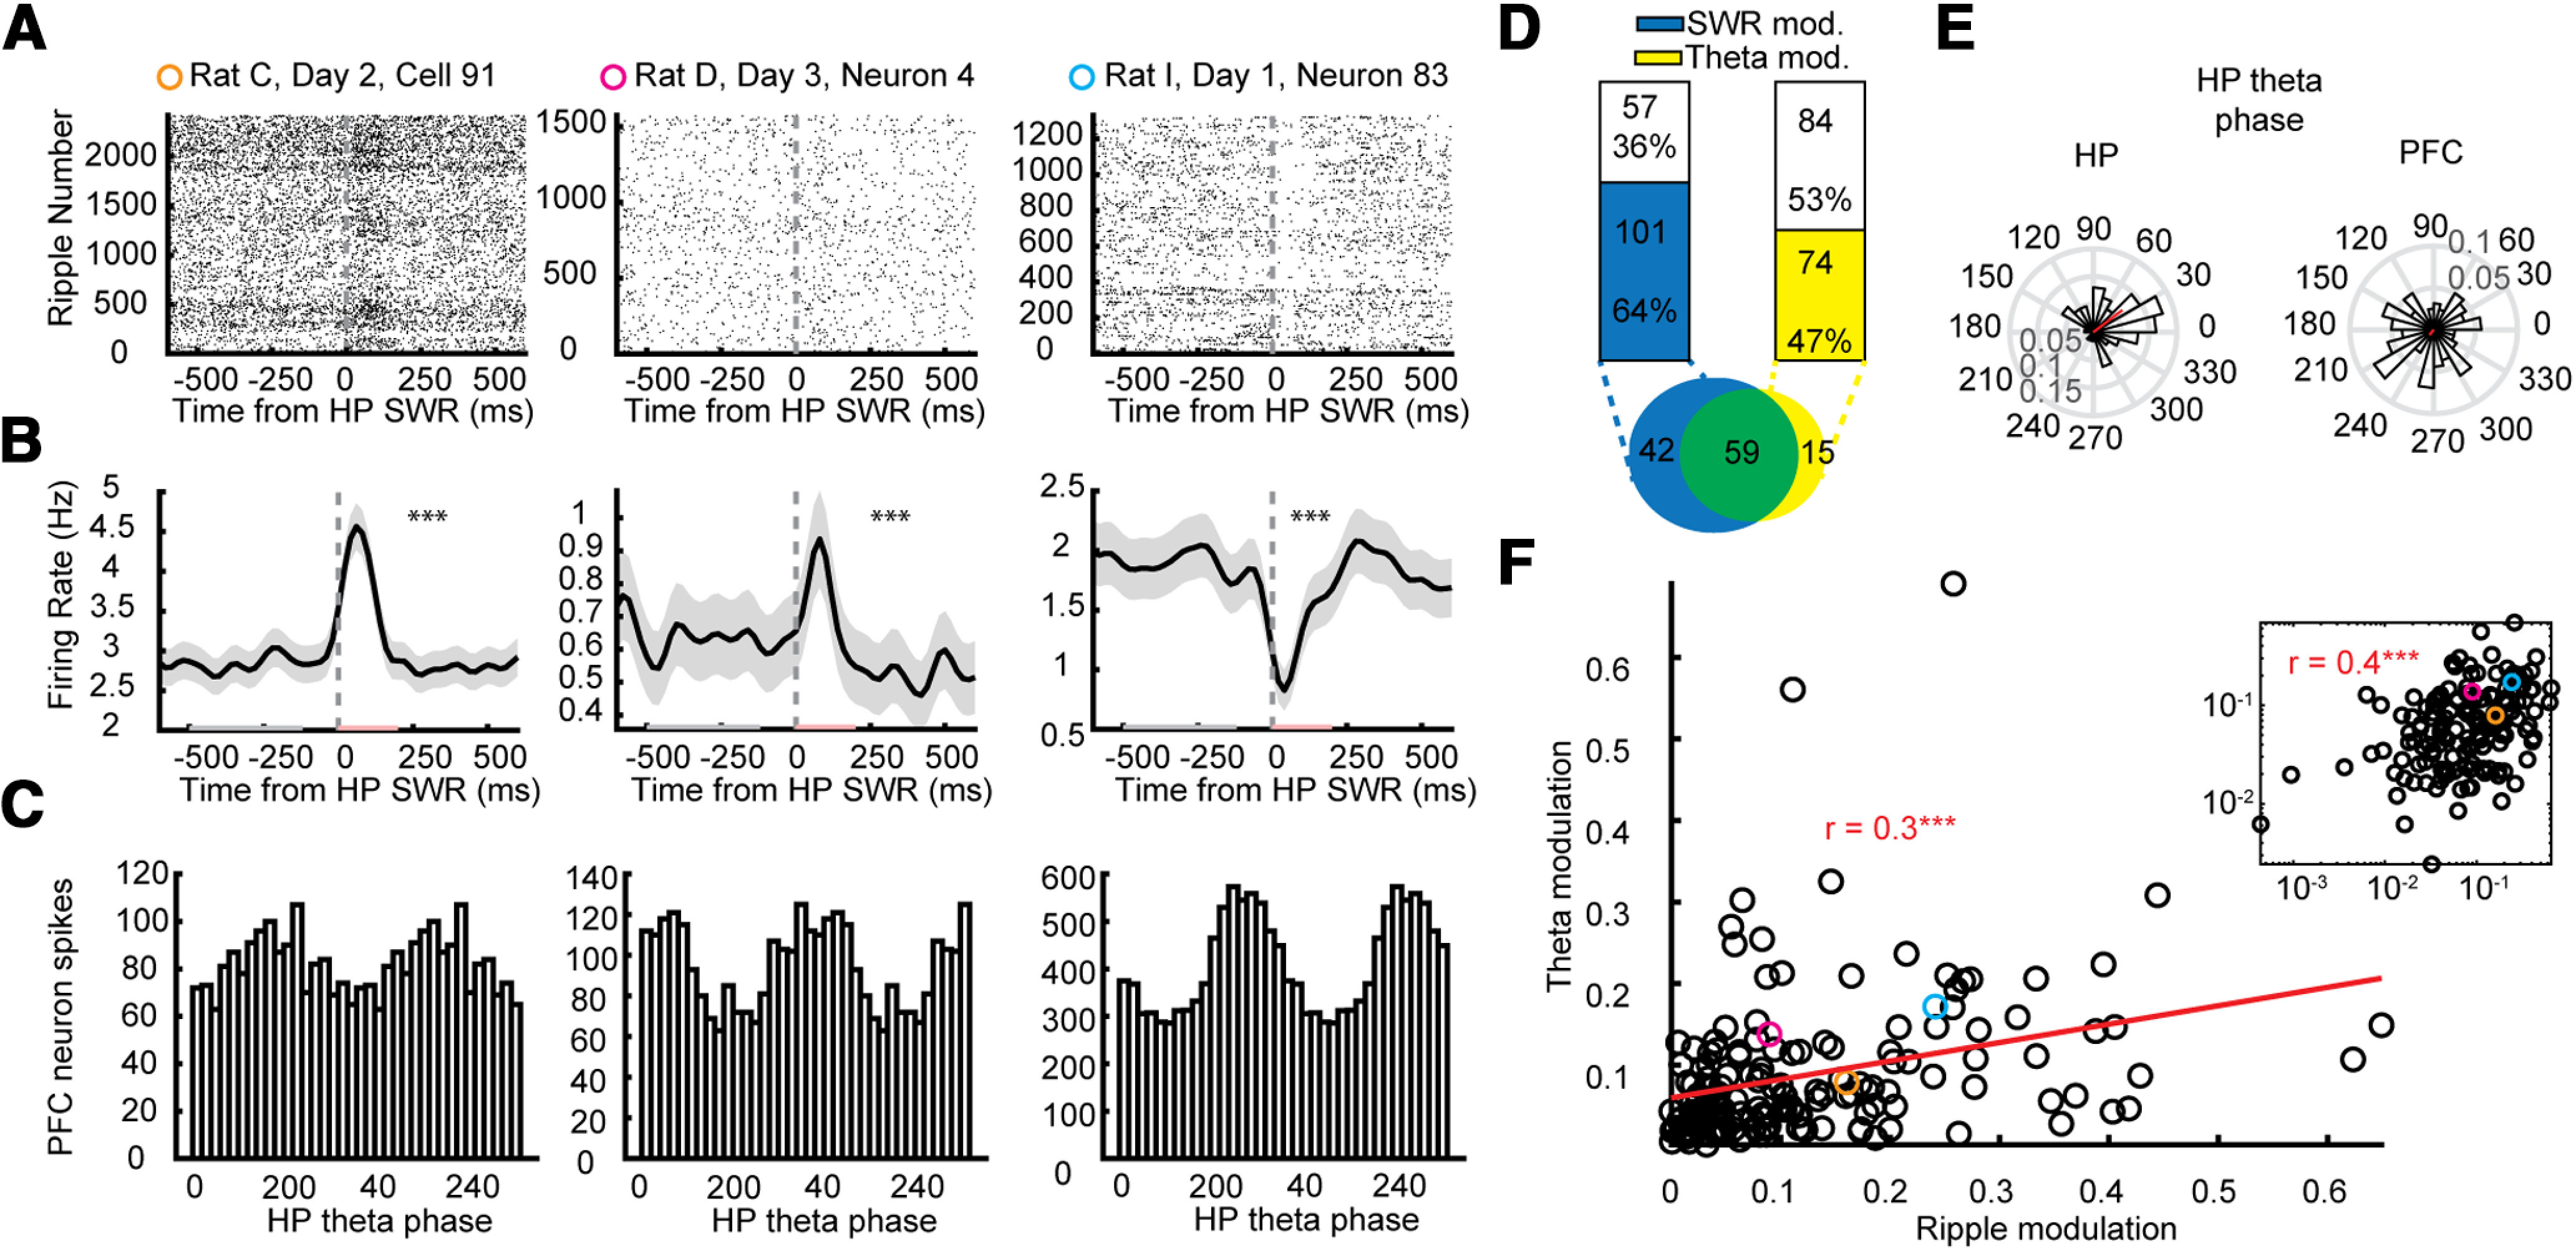
Figure 2.

PFC neurons were modulated to HP ripple events and HP theta. A, Three example PFC neurons' raster plot of firing centered on HP ripple events. B, Average ripple-triggered firing rates of the same three PFC neurons in A; p values are from a permutation test using a distribution of circularly shifted firing rates. C, Histograms of the same three PFC neurons' spikes as a function of HP theta phase. D, left, 64% of PFC neurons were significantly modulated by HP ripples (permutation test p < 0.05); 58% of ripple-modulated neurons were modulated by theta compared with only 26% of non-ripple-modulated neurons. Right, 47% of PFC neurons were significantly modulated by HP theta (Rayleigh test p < 0.05); 80% of theta-modulated neurons were modulated by ripples compared with only 50% of non-theta-modulated neurons. Inset below, Venn diagram of neurons modulated by ripples (blue), theta (yellow), and both (green). E, Histogram of the mean theta preference for each HP neuron (top) and PFC neuron (bottom) to HP theta. F, The more a PFC neuron was modulated to HP ripples (absolute value of the FR in postripple (red in B) minus preripple (gray in B; period normalized by sum of both) the more it tended to be modulated to HP theta (mean resultant vector). Pearson's correlation, R = 0.30, p = 1.3e-4. Inset, Same data plotted on a log-log scale (Person's correlation: R = 0.42, p = 6.2e-8). The three examples shown in the left, middle and right panels of A–C are depicted in in orange, pink, and blue, respectively.
