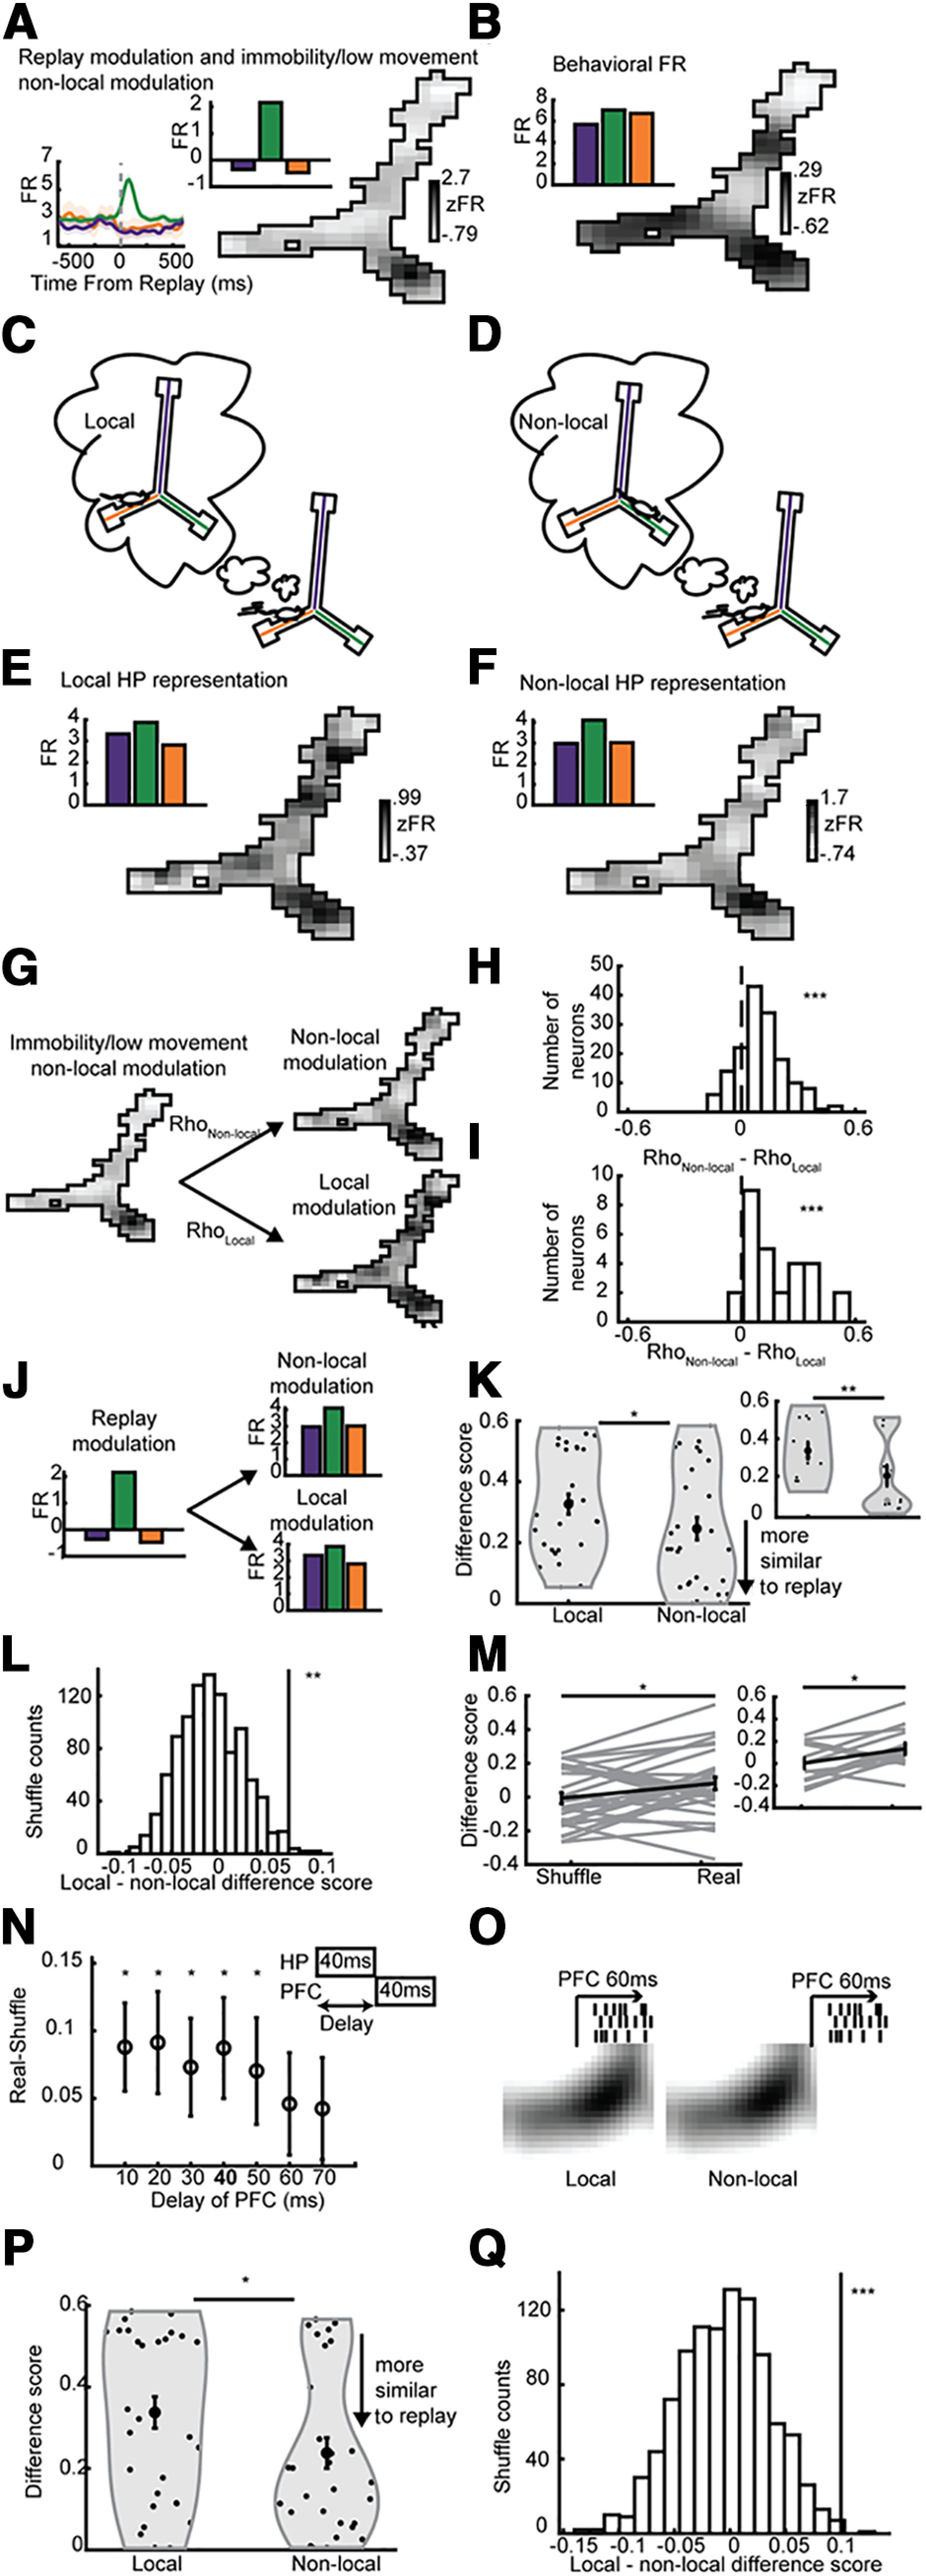
Figure 6.

PFC neurons were modulated to non-local HP representations similarly during rest and running. All panels show PFC neurons' firing patterns as a function of conditions determined by HP firing. A, A PFC neuron's modulation to non-local HP representations of position while the rat is still. Bottom inset, Neuron's arm-replay triggered firing rate. Top insets in A, B, F, G show bars depicting the PFC neurons' firing pattern across the arms in each of the four conditions. B, The same neuron's firing rate across position of the rat during running. HP local (C) and non-local HP (D) representation during running. PFC firing rate map as a function of local (E) and non-local (F) HP representation. G, Depiction of Pearson's correlation between the PFC replay map (as in A) with the local (RhoLocal) and non-local (RhoNon-local) maps (as in E, F). H, The difference between non-local and local correlations (RhoNon-local-RhoLocal) across all PFC neurons. One-sided Wilcoxon signed-rank test, N = 158, 158, z = 8.53, p < 10–17. I, Across significantly arm-modulated PFC neurons. One-sided Wilcoxon signed-rank test, N = 28, 28, z = 4.41, p < 10–5. J, A difference score was computed between PFC modulation to arms during replay and both local and non-local modulation to arms. K, The non-local difference score was less than that of local, one-sided Wilcoxon signed-rank test, N = 28, 28, z = 2.06, p = 0.0197. Inset, Only using one session per rat, N = 14, 14, signed-rank = 93, p = 4.3e-3. L, The true local-non-local difference was greater than a distribution produced by shuffling non-local representations, p = 9.0e-3. M, The real difference score was greater than the shuffle across the significantly arm-replay modulated neurons, one-sided Wilcoxon signed-rank test, N = 28, 28, z = −2.1, p = 0.017. Inset, Only using one session per rat, N = 14, 14, signed-rank = 18, p = 0.015. N, The analysis presented here used a 40-ms delay between HP local/non-local activity and PFC activity (inset and bolded x-axis label), but delays between 10 and 50 ms also produced similar and significant results; p = 0.014, 0.012, 0.021, 0.017, 0.033, 0.12, 0.14. O, A schematic showing the comparison of PFC's response to local versus non-local parts of the theta cycle. P, Non-local portions of the theta cycle produced PFC firing patterns across the three arms that better matched PFC's responses to replay. One-sided Wilcoxon signed-rank test, N = 28, 28, z = 1.88, p < 0.04. Q, Permutation test with shuffled labels of first and second half of theta cycle, p < 0.002. All error bars represent SEM; ***p < 0.001, **p < 0.01, *p < 0.05. Shading represents SEM.
