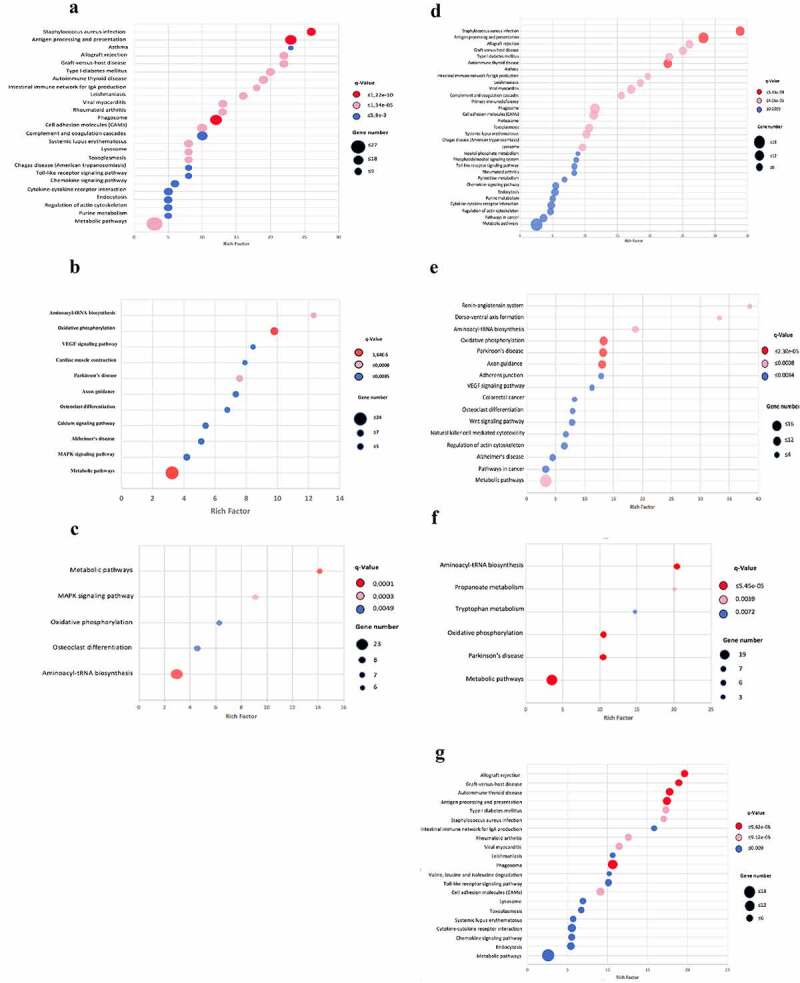
Figure 4.

Scatter plot of the KEGG pathway enrichment analysis for DEGs during infection with Beijing strains. Each circle in the graph represent a KEGG pathway, with its name in the Y-axis and the enrichment factor indicated in the X-axis. Rich factor is the ratio of the numbers of DEGs annotated in each pathway related to the proportion of all genes mentioned in the same pathway. Higher enrichment factor means a more significant enrichment of the DEGs in a given pathway. The color of the circle represented the q-value, which was the adjusted P after multiple hypothesis testing, ranging from 0–1. A smaller q-value indicated a higher reliability of the significance of the enrichment of DEGs in each pathway. The sizes of the circles represent the number of enriched genes. Left panel: mice infected with BL strain; A) Down regulated genes at 14 dpi. B) Over-expression genes at 14 dpi. C) Over-expression genes at 28 dpi. Right panel: mice infected with Classical Beijing strain; D) Down regulated genes at 14 dpi. E) Over-expression genes at 14 dpi. F) Over-expression genes at 28 dpi. G) Over-expression genes at 60 dpi
