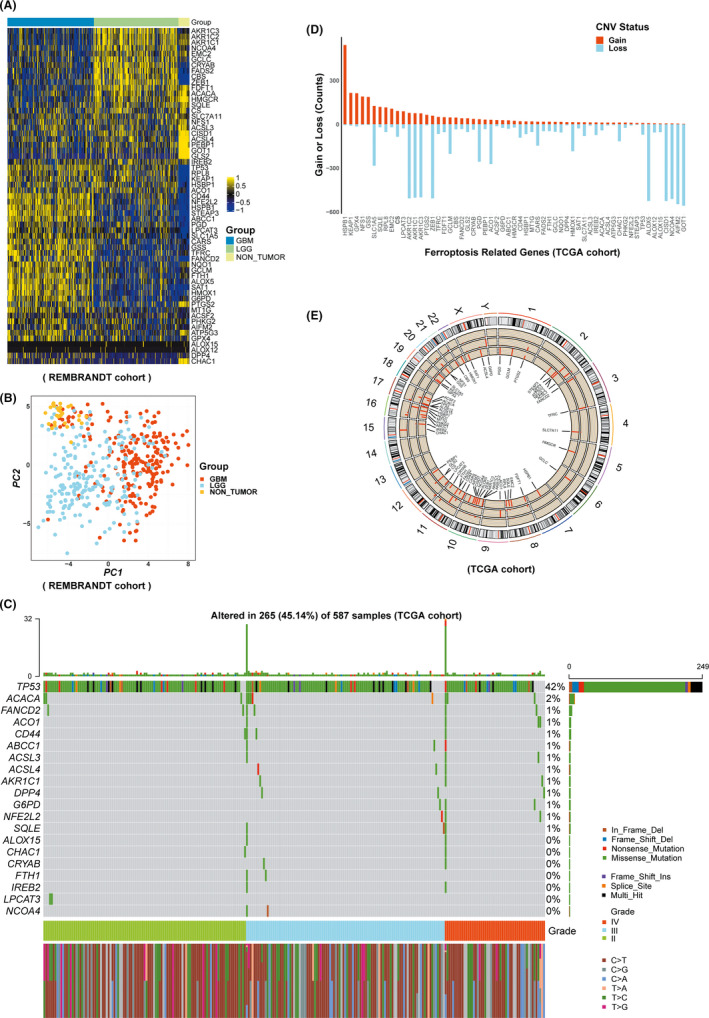
FIGURE 2.

Landscape of ferroptosis‐related genes (FRGs) in REMBRANDT and TCGA cohorts. A, The differential expression of FRGs in GBM, LGG, and NON‐TUMOR tissue samples in REMBRANDT cohort. B, Indicates the principal component analysis results can be completely distinguished from GBM, LGG, and NON‐TUMOR groups on the basis of the expression of FRGs in REMBRANDT cohort. C, The variation of FRGs in TCGA cohort. D, CNV status analysis in TCGA cohort. E, The location and mutation frequency of CNV of 59 FRGs in TCGA cohort
