
FIGURE 3.
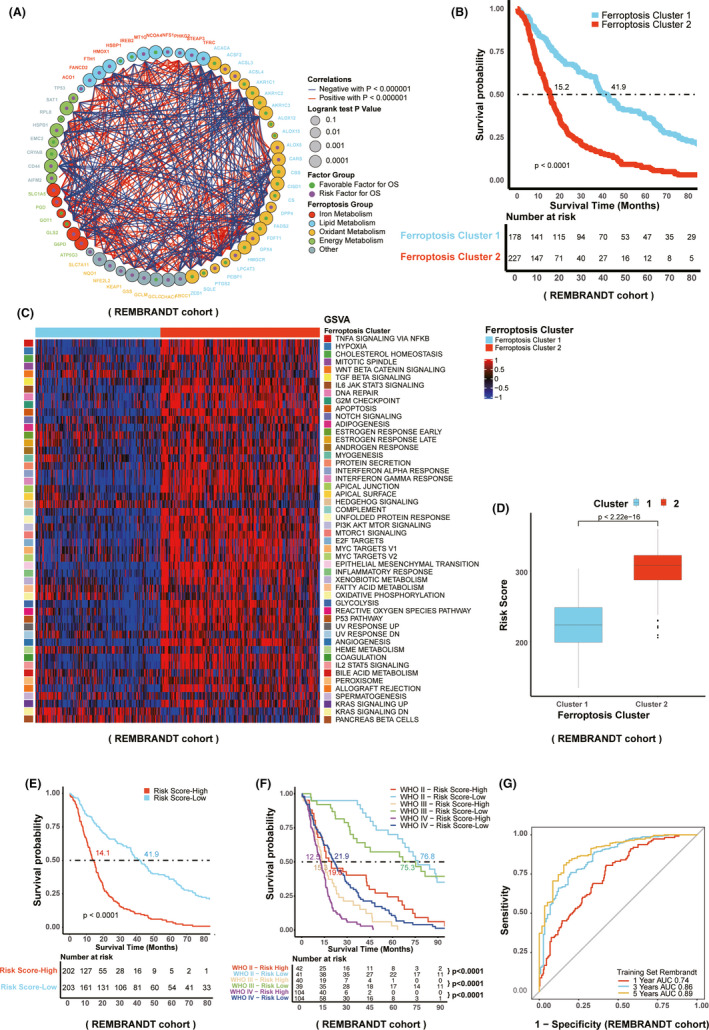
Development of the FRGs‐related risk score in REMBRANDT cohort. A, Shows 59 FRGs are divided into five categories including iron metabolism, lipid metabolism, oxidant metabolism, energy metabolism, and others. B, The relationship between distinct ferroptosis clusters and glioma patients’ prognosis. C, Indicates ferroptosis cluster 2 is associated with 50 well‐defined hallmark gene sets which are involved in all kinds of biological processes. D, The relationship between risk score and ferroptosis clusters. E, The relationship between risk score and clinical outcome of glioma patients. F, Effects of distinct risk score in different glioma grades according to WHO on the survival probability in glioma patients. G, Shows ROC curve analysis reflecting the predictive value of risk score in the glioma patients’ outcome in the aspect of 1 year AUC, 3 years AUC, and 5 years AUC