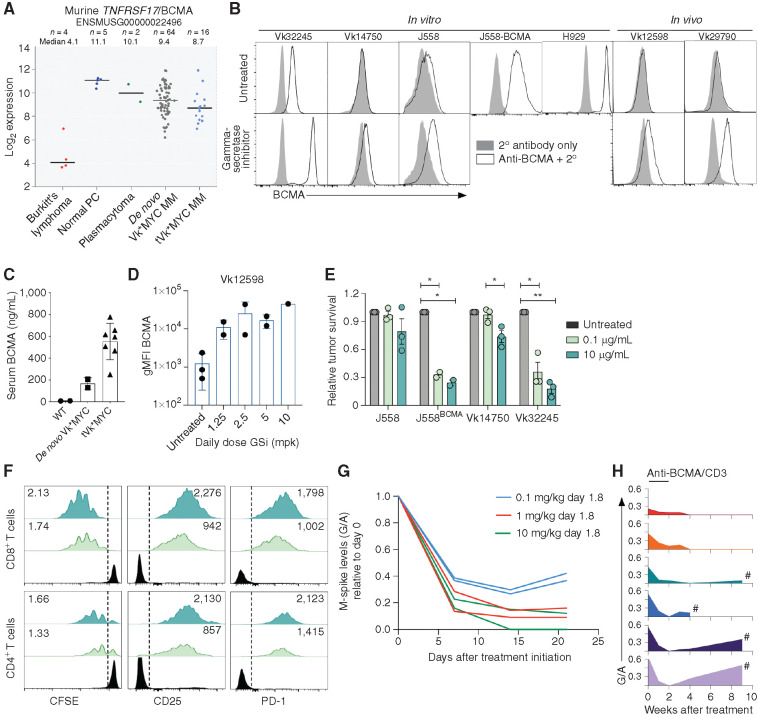
Figure 1.
BCMA is a target for bispecific immunotherapy in Vk*MYC multiple myeloma (MM). A, Robust multi-array average (RMA)–summarized expression values of Tnfrsf17/BCMA mRNA of Vk*MYC-derived lymphoma cell lines, normal PCs, Balb/c plasmacytoma cell lines, Vk*MYC de novo multiple myeloma and transplantable cell lines (tVK*MYC). Line at median is shown for each group. B, BCMA cell-surface staining (white histogram) by flow cytometry (FCM) of cell lines or primary multiple myeloma cells with (bottom) or without (top) GS inhibition (DAPT 1 μmol/L, 18 hours for in vitro, and LY-411575-I at 5 mg/kg for in vivo treatment). The gray histogram depicts negative control staining with secondary antibody only. C, sBCMA levels quantified by ELISA in the serum of moribund tumor-bearing or age-matched wild-type (WT) control mice. Each symbol represents one untreated mouse, tested in duplicate. D, Surface BCMA quantified by FCM (geometric mean fluorescence intensity, gMFI) of ex vivo CD138+ tumor cells harvested from Vk12598 tumor–bearing mice left untreated or treated for 48 hours with the GS inhibitor (GSi) LY-411575-I at the indicated dose. Each dot represents an individual mouse. E, Tumor cell survival after incubation in vitro with splenocytes and BCMA/CD3 BsAb at two different concentrations, normalized to the untreated conditions. P values determined using multiple comparison t tests with Holm–Sidak adjustment. P values are denoted by asterisks: *, P < 0.05; **, P < 0.01. F, FCM analysis of T cells from killing assay in E, representative of triplicate tests. The proliferation index is in the top left and the gMFI for the indicated markers is presented in the top right corner of both plots. G, M-spike levels (G/A relative to day 0) over time (days) in six de novo Vk*MYC mice treated with increasing doses of anti-BCMA/CD3 BsAb. H, M-spike levels (G/A) over time (weeks) in six de novo Vk*MYC mice treated with 1 mg/kg anti-BCMA/CD3 BsAb on days 1 and 8. Each mouse is represented by a different colored histogram. # shows mice that succumbed to tumor burden.

